This document describes how to use some scanpy-based scRNAseq workflows on galaxy Australia.
The aim of these workflows is to handle the routine ‘boring’ part of single cell RNAseq data processing. It will produces an ‘AnnData’ object, which can then be used as a base for downstream analysis – either within galaxy or outside of it. AnnData is a standard format used by the ‘scanpy’ python package.
These workflows represent just one way of processing data for a ‘typical’ scRNAseq experiment – there are many other options!
Workflows
This document describes a set of workflows for processing single cell RNAseq data with scanpy
These workflows are all available on galaxy australia.
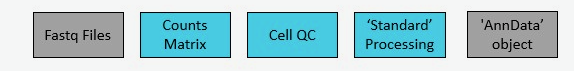
Standard workflows
With 3 ways to load the data:
- Load counts matrix: import This workflow takes a counts matrix (of form counts.mtx + genes.csv + features.csv), loads the data into a standard AnnData format and adds a sample name.
- Count and load (starSOLO): import This workflow takes fastq files, uses starSOLO to generate a counts matrix, loads the data into a standard AnnData format and adds a sample name.
- Count and Load (Cell Ranger): import This workflow takes fastq files, uses Cell Ranger to generate a counts matrix, loads the data into a standard AnnData format and adds a sample name.
Followed by two steps of routine processing:
- Single cell QC: import This workflow generates some basic QC plots and applies filtering
- Single cell QC to basic processing: import This generates a UMAP, does clustering and calculates cluster marker genes.
Background
There are many general resources online about the principals of single cell analysis. The Scanpy preprocessing and clustering tutorial may be of particular use because it describes the scanpy methods used in this workflow. Even if you don’t use the python code, it works through and explains many of the plots these workflows generate.
General information on using galaxy can be found on the galaxy training website
For more general information about single cell RNAseq processing on galaxy; there are some excellent tutorials to be found here on the galaxy training website scRNA section. The workflow implemented here is heavily influenced by the Clustering 3kPBMCs with Scanpy tutorial
Analysis overview
- Start with fastq files.
- Cell Ranger or starSOLO will align the reads to the genome, and make a table of the number of times each gene is counted per cell.
- Perform some basic QC on the counts matrix, and filter out ‘cells’ that have too little RNA counts or too much mitochondrial gene content
- Run some basic single cell analyses: Normalisation, PCA, UMAP, clustering and identify cluster markers
- The resulting AnnData object can be analysed further. See ‘Next steps’
When run in full, these workflows produce the following main outputs
- A processed AnnData file, which contains gene expression and annotation information ready for downstream analysis.
- Tables of ‘marker’ gene information - to aid determination of cell types present in the experiment
- Two report summaries.
User guide
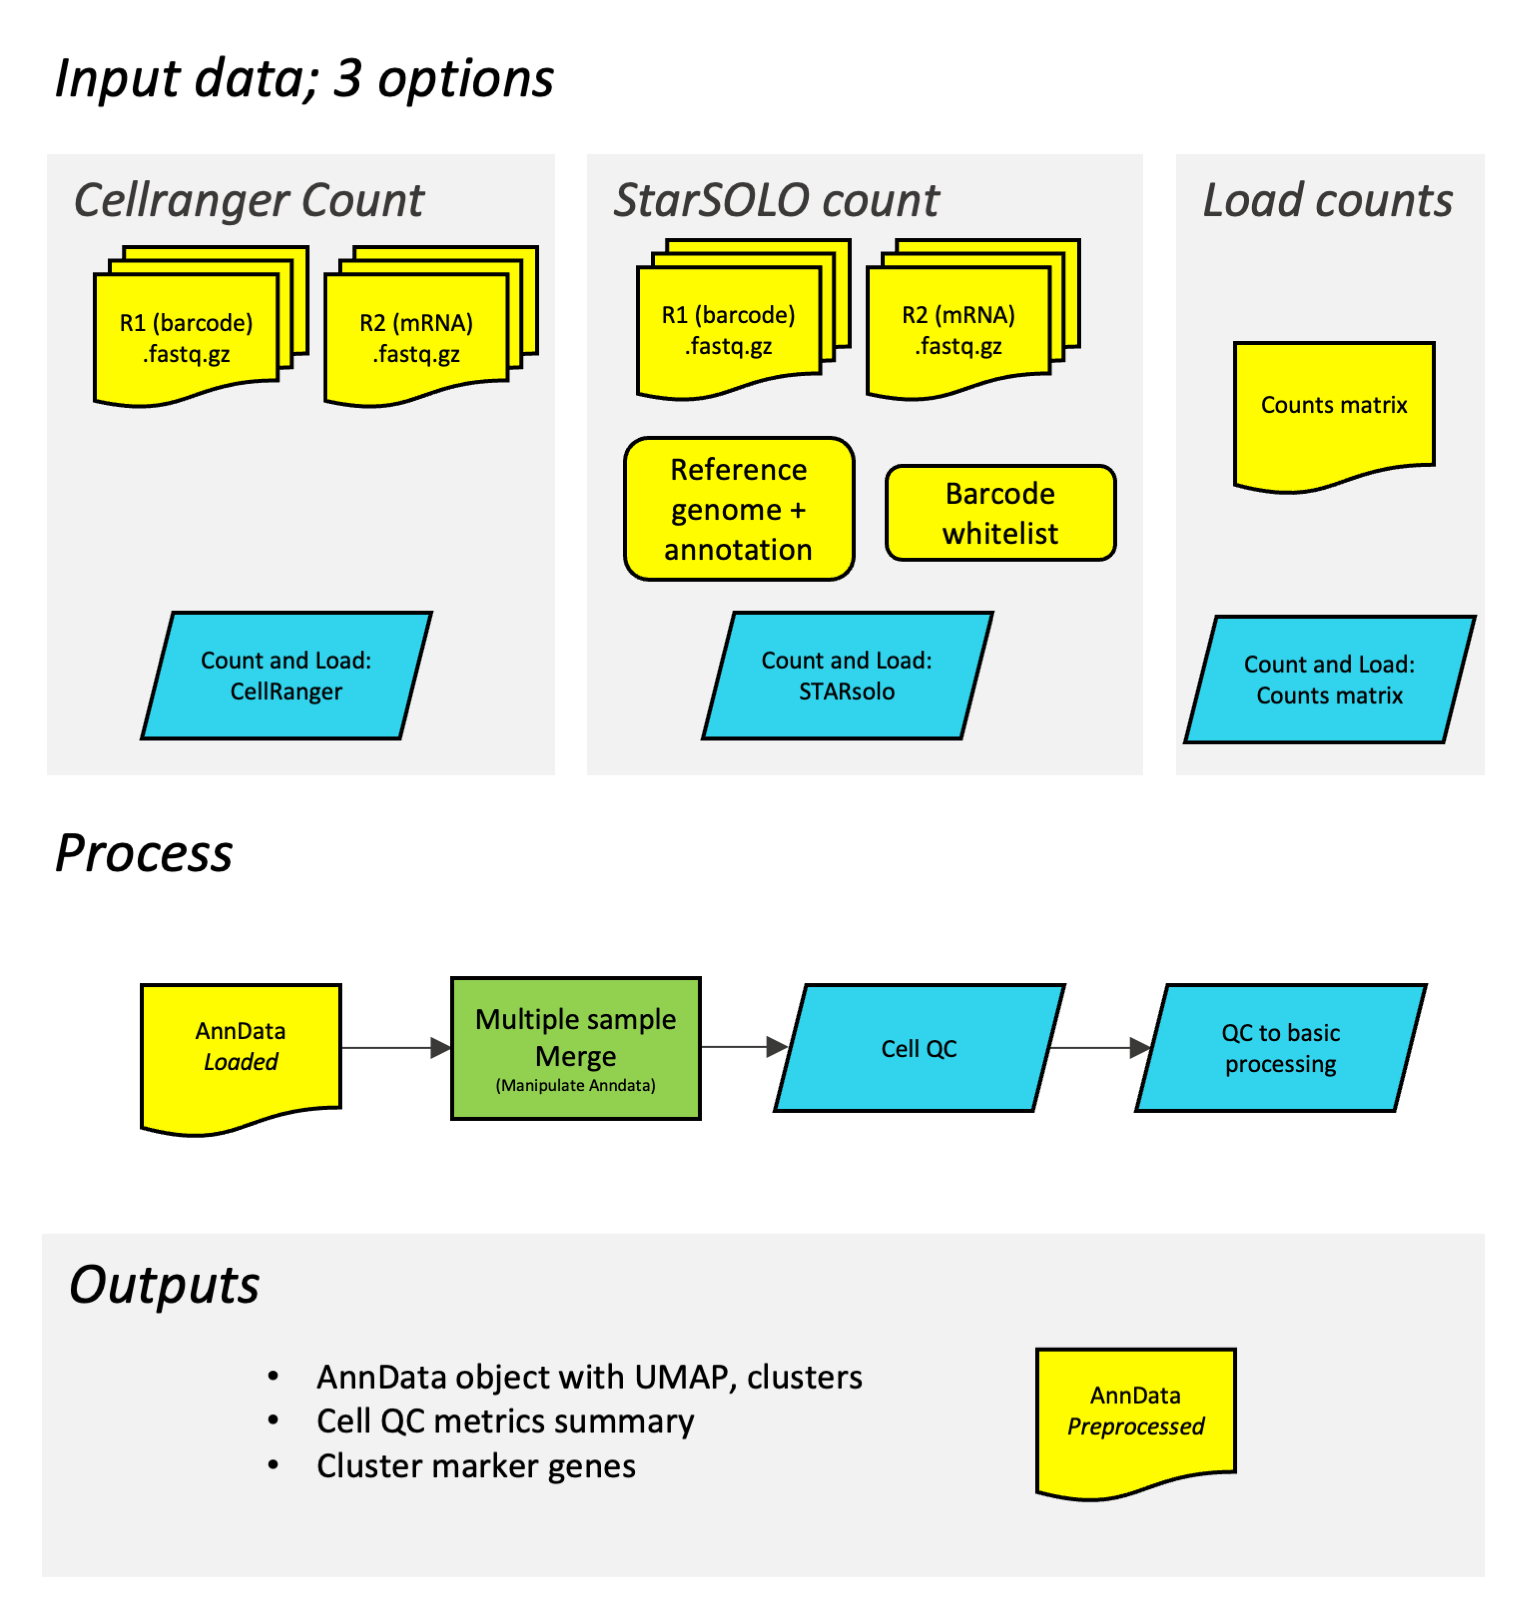
This diagram shows how the different workflows work together. In the initial step of building the counts matrix, the process depends on are using Cell Ranger, StarSOLO or a preexisting counts matrix. The subsequent process is the same.
What are the 3 different options?
- Cell Ranger: Developed by 10X genomics, this is a widely used package that works for 10X genomics data. Usage is subject to licence conditions (see Licences section) and available only to registered users. Currently only the inbuilt human and mouse references are available (it is possible to build and use a custom reference on galaxy, but not within this workflow).
- StarSOLO: An open source alternative, which can be configured to support different sequencing technologies or custom references.
- Counts matrix: Sometimes you already have a counts matrix - these are available for many public datasets already. Or, if you are using data from probe-based kits (e.g. 10X fixed rna kit), you’ll need to get your counts matrix as described by the manufacturer.
Prepare your fastq inputs
Single cell sequencing data is typically generated as paired-end sequencing data. This is handled by ‘collections’ in galaxy. For more information what a galaxy collection is see guide to collections in galaxy
Cell Ranger and starSOLO expect fastq files to be arranged in slightly different collections, as described below.
For Cell Ranger
Cell Ranger expects fastq files in a simple collection.
- Load the _R1 and _R2 fastq files into your galaxy history. See guide to loading data for details.
-
Select the fastq files that make up one biological sample. Typically this may be 2 files (R1 and R2), but there can be more (e.g. often multiple lanes).
a. Click the ‘tick in a box’ select files button at the top of the history (dataset) panel. b. Checkboxes appear for all history items - check the specific files needed. c. There will be a dropdown button at the top of the history panel - ‘selected’ - hit this, and select ‘Build dataset list’
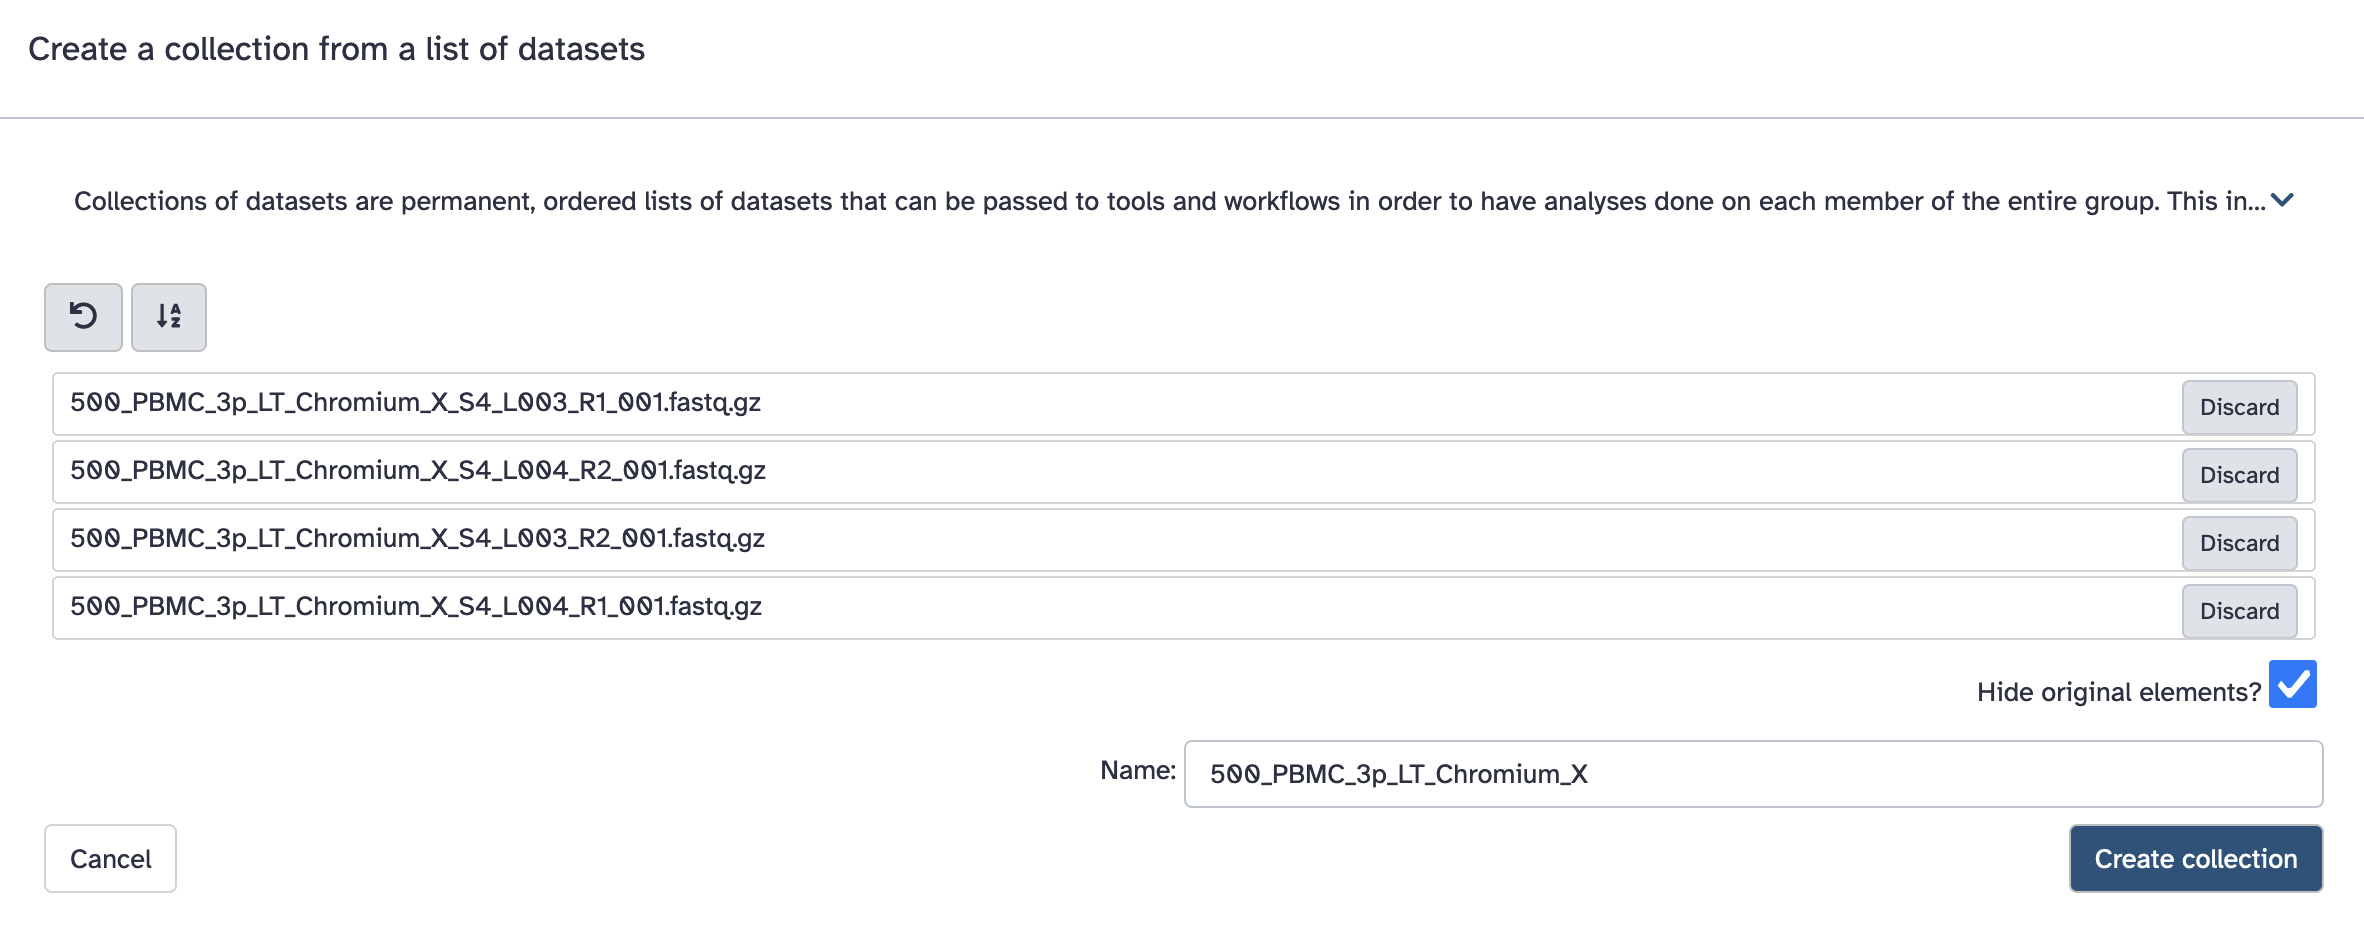
However it expects the collection to be named in a particular way. Fastq files will typically have names like: SomeSample_S2_L001_R1_001.fastq.gz, and the collection should be named with everything before _S2_L001_R1_001.fastq.gz. Here that is ‘500_PBMC_3p_LT_Chromium_X’.
ERROR: Requested sample(s) not found in fastq directory. Available samples: ...; this indicates a mismatch between the collection name and filenames. Consider renaming your collection to what is listed as an available sample.For starSOLO
In galaxy, we can store paired sequencing data in a ‘paired collection’ - that way the R1 and matched R2 will always be together.
These workflows expect a paired collection of data for one sample. Its possible to have multiple fastq pairs for one biological sample - but this workflow will usually be run on a paired collection of one pair.
You may also have I1 and I2 fastq datasets, but these are indices not used in these pipelines. If necessary, data should be demultiplexed before starting - each R1/R2 file pair should only contain data from one sample.
-
Load the _R1 and _R2 fastq files into your galaxy history. See guide to loading data for details.
-
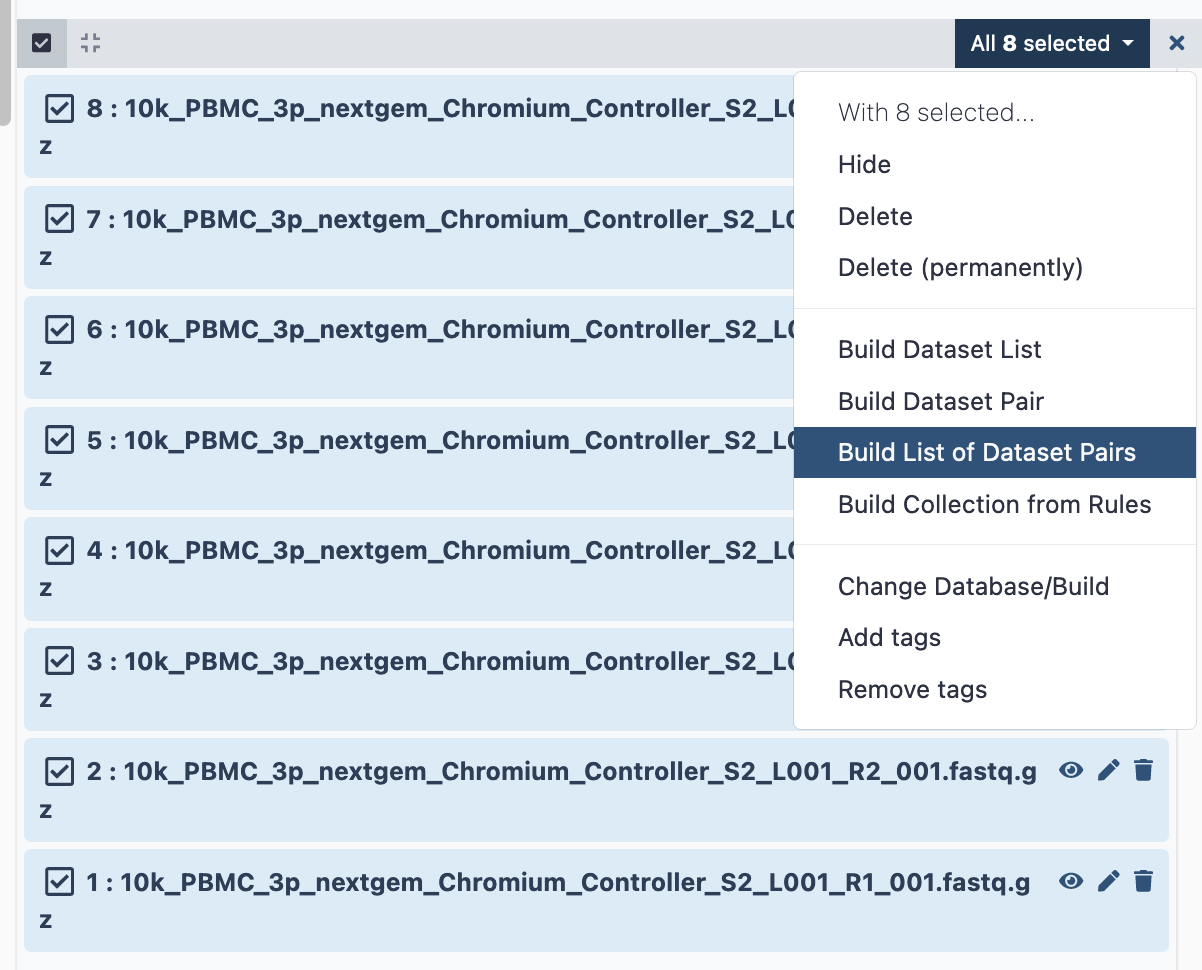
Select the fastq files that make up one biological sample. Typically this may be 2 files (R1 and R2), in this case, there are 4.
a. Click the ‘tick in a box’ select files button at the top of the history (dataset) panel. b. Checkboxes appear for all history items - check the specific files needed. c. There will be a dropdown button at the top of the history panel - ‘selected’ - hit this, and select ‘Build list of dataset pairs’
- This brings up a new window to indicate the forward and reverse reads. It may initially say that it cannot create any pairs. In this case, we need to update the ‘Forward’ box to ‘_R1’ and the reverse to ‘_R2’. These identifiers are then found in the filenames.
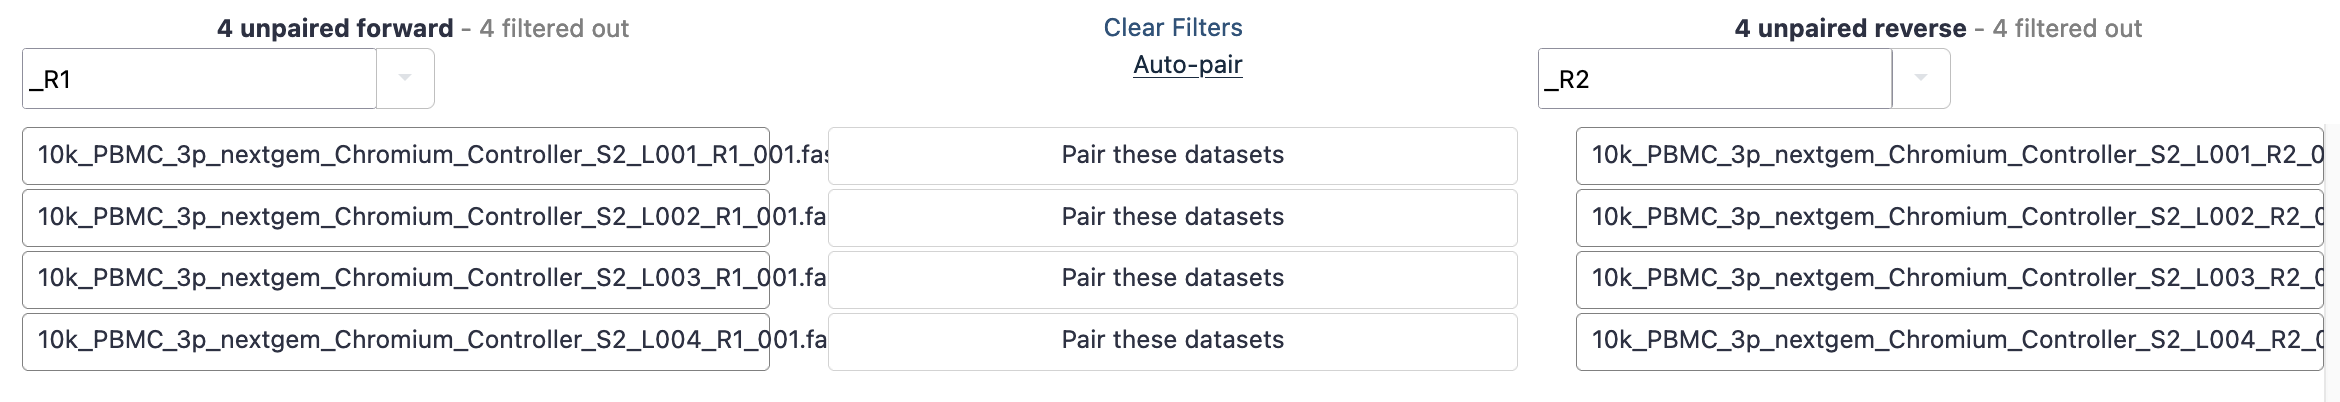
- Hit ‘auto-pair’ and now they are highlighted green as below.
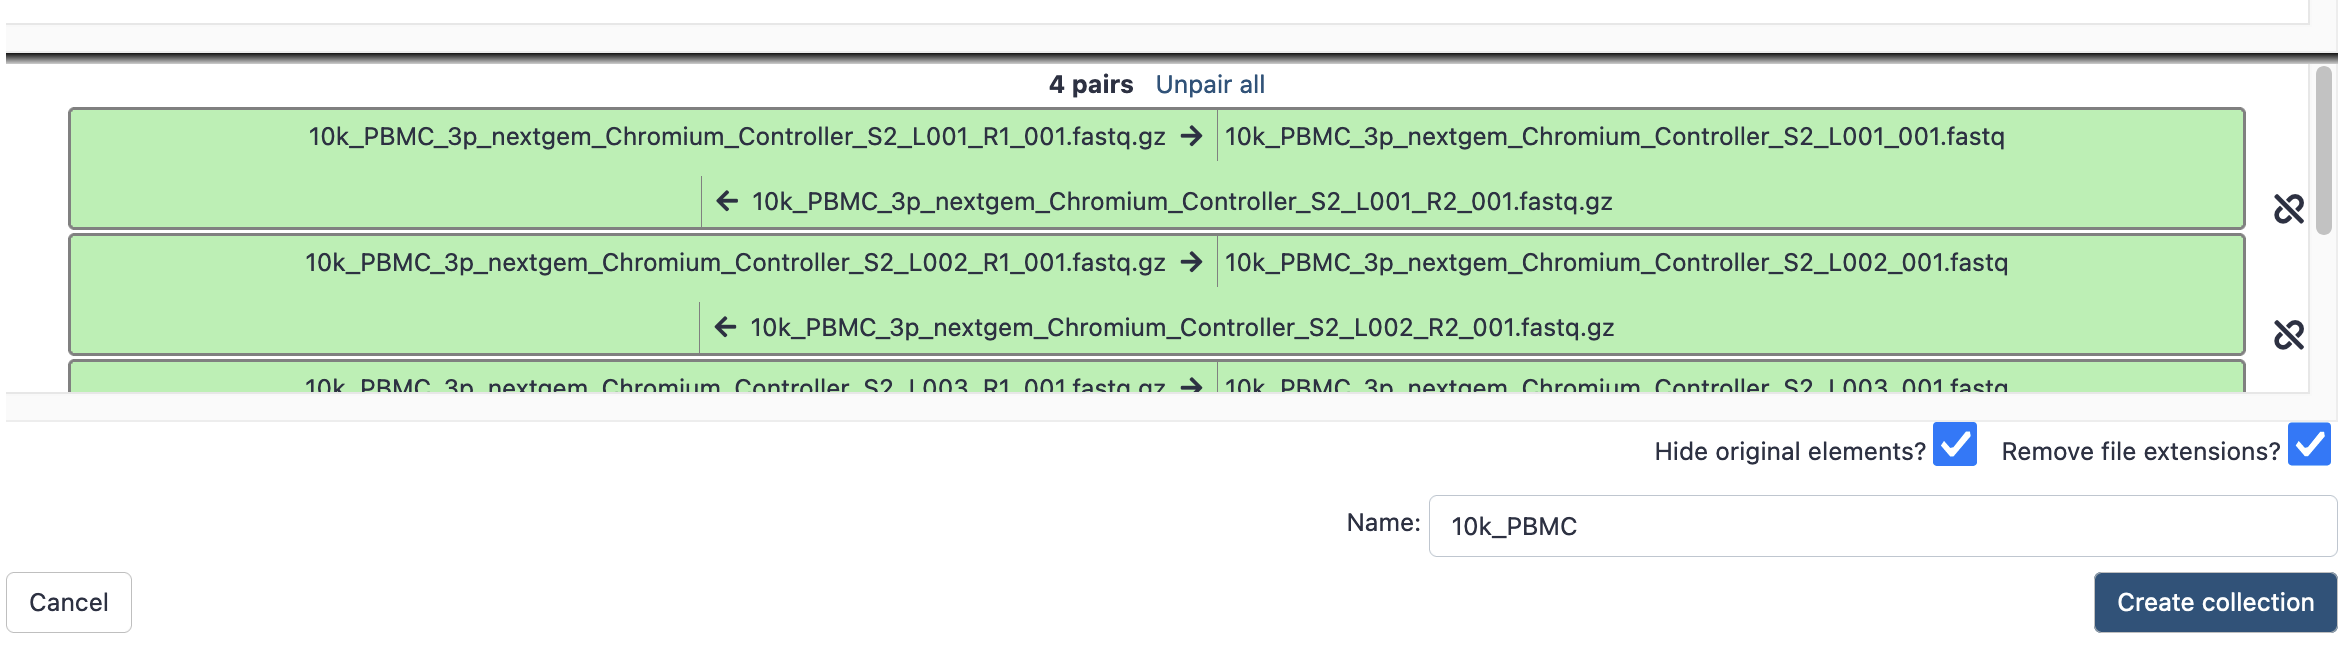
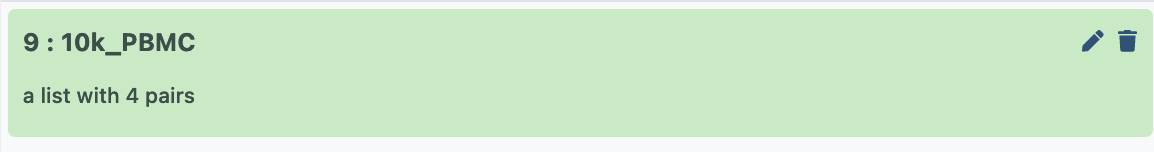
- Give it a sensible name, then hit ‘create collection’, and now that paired collection will be visible in your history as below;
Building a counts matrix
This part of the workflow will create or load the counts matrix for a single sample, load it into an AnnData object, and then adds a column to the metadata called ‘sample’. This means the sample information can be tracked when multiple samples are combined.
Using Cell Ranger
The input for the star solo workflow is:
- Fastq files: prepared as above
- Reference: Only if not working with human or mouse.
-
If you haven’t already, apply for access to Cell Ranger - see Getting access to cell ranger. Otherwise Cell Ranger won’t be visible in your tools list, and you won’t be able to use it!
-
Import the Count and Load (Cell Ranger) workflow (listed above).
-
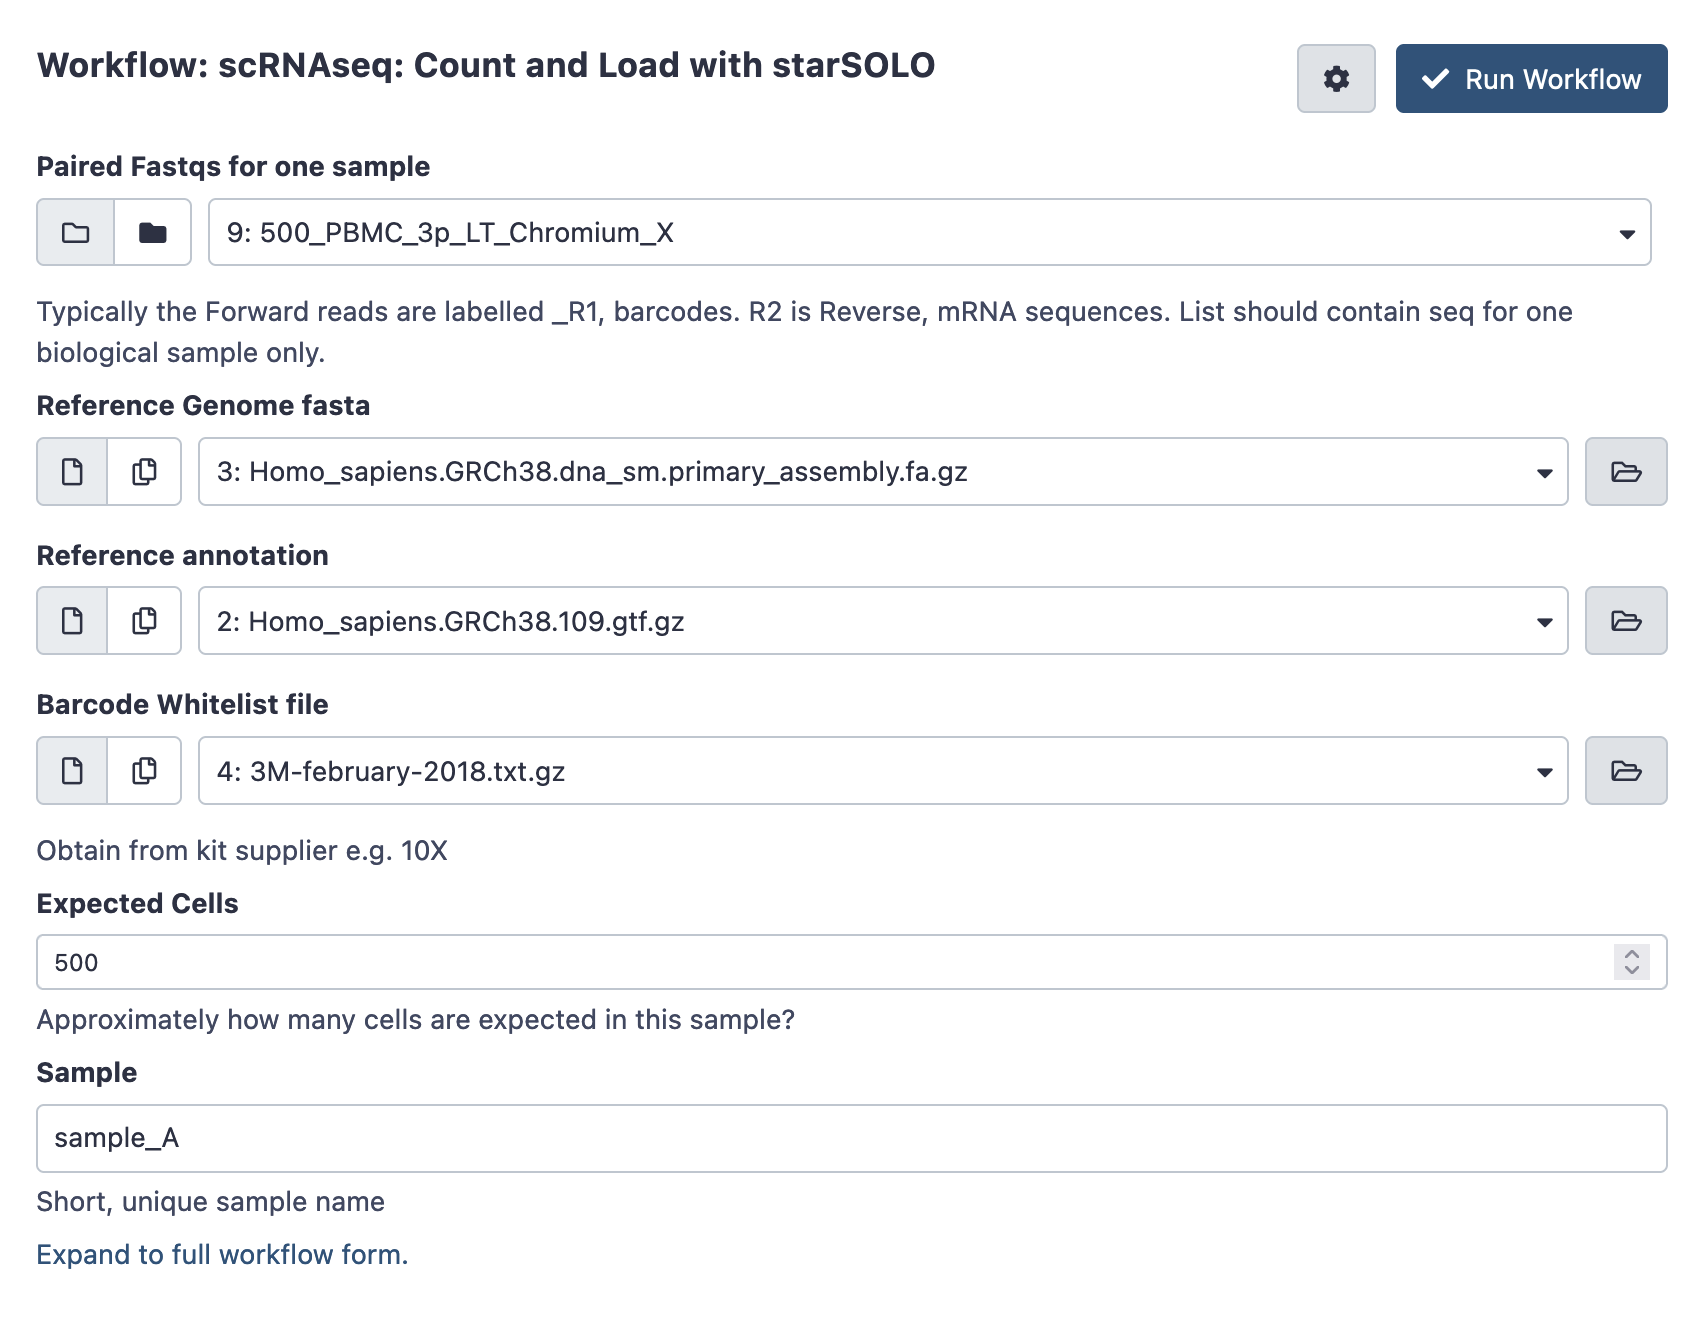
Open the workflow menu, find the workflow and hit run to bring up the following launch form. The first option ‘Fastqs for one sample’ should be the paired collection you created and named above. You’ll also be prompted to customise any filtering parameters, and choose a sensible name for the biological sample.
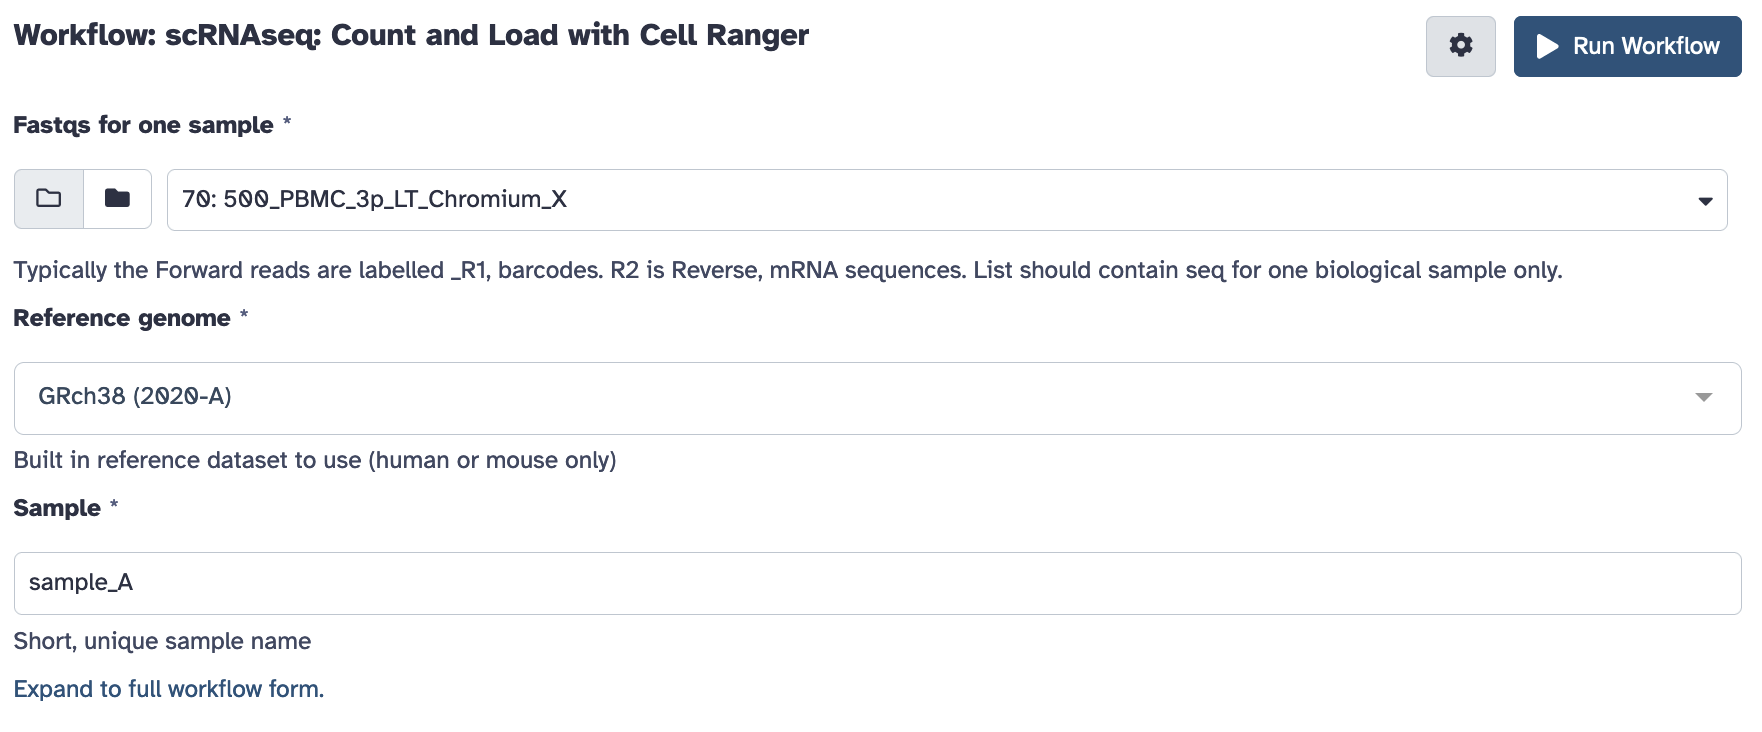
Once ready hit the ‘run workflow’ button. This pipeline should take an hour or several to run.
Using StarSOLO
The input for the star solo workflow is:
- Fastq files: prepared as above
- Whitelist files: The list of expected barcodes in the kit - which varies by technology and chemistry. For 10X chromium data see here; https://kb.10xgenomics.com/hc/en-us/articles/115004506263-What-is-a-barcode-whitelist- . The file you need for each kit is listed, and the files themselves can be obtained by downloading the Cell Ranger software package.
- Reference: Genome and matching annotation reference (see below).
StarSOLO will require a genome sequence file (fasta format), and a .gtf or .gff file of the gene positions. Take care to ensure these are from the same genome version. A good source of suitable reference/annotation pairs for a wide range of species is the ensembl download index. For example, human reference data at ensembl v109:
- GRCH38 primary assembly: Homo_sapiens.GRCh38.dna_sm.primary_assembly.fa.gz
- Gene Annotation : Homo_sapiens.GRCh38.109.gtf.gz
You can supply links to that data directly to a galaxy history via upload data > Paste/Fetch data, so there’s no need to download/upload large files from your computer. And since you’ll likely want to reuse the same reference in new analyses, its possible to copy to new histories as needed. Note that the current configuration of StarSOLO will build a reference every time it is run, which can take some time.
-
Load your input files into galaxy.
-
Import the Count and load (starSOLO) workflow (listed above)
-
Open the workflow menu, find the workflow and hit run to bring up the following launch form. The first option ‘paired fastqs for one sample’ should be the paired collection you created and named above. You’ll also be prompted to customise any filtering parameters, and choose a sensible name for the biological sample.
Once ready hit the ‘run workflow’ button. This pipeline should take an hour or several to run.
With a Counts matrix
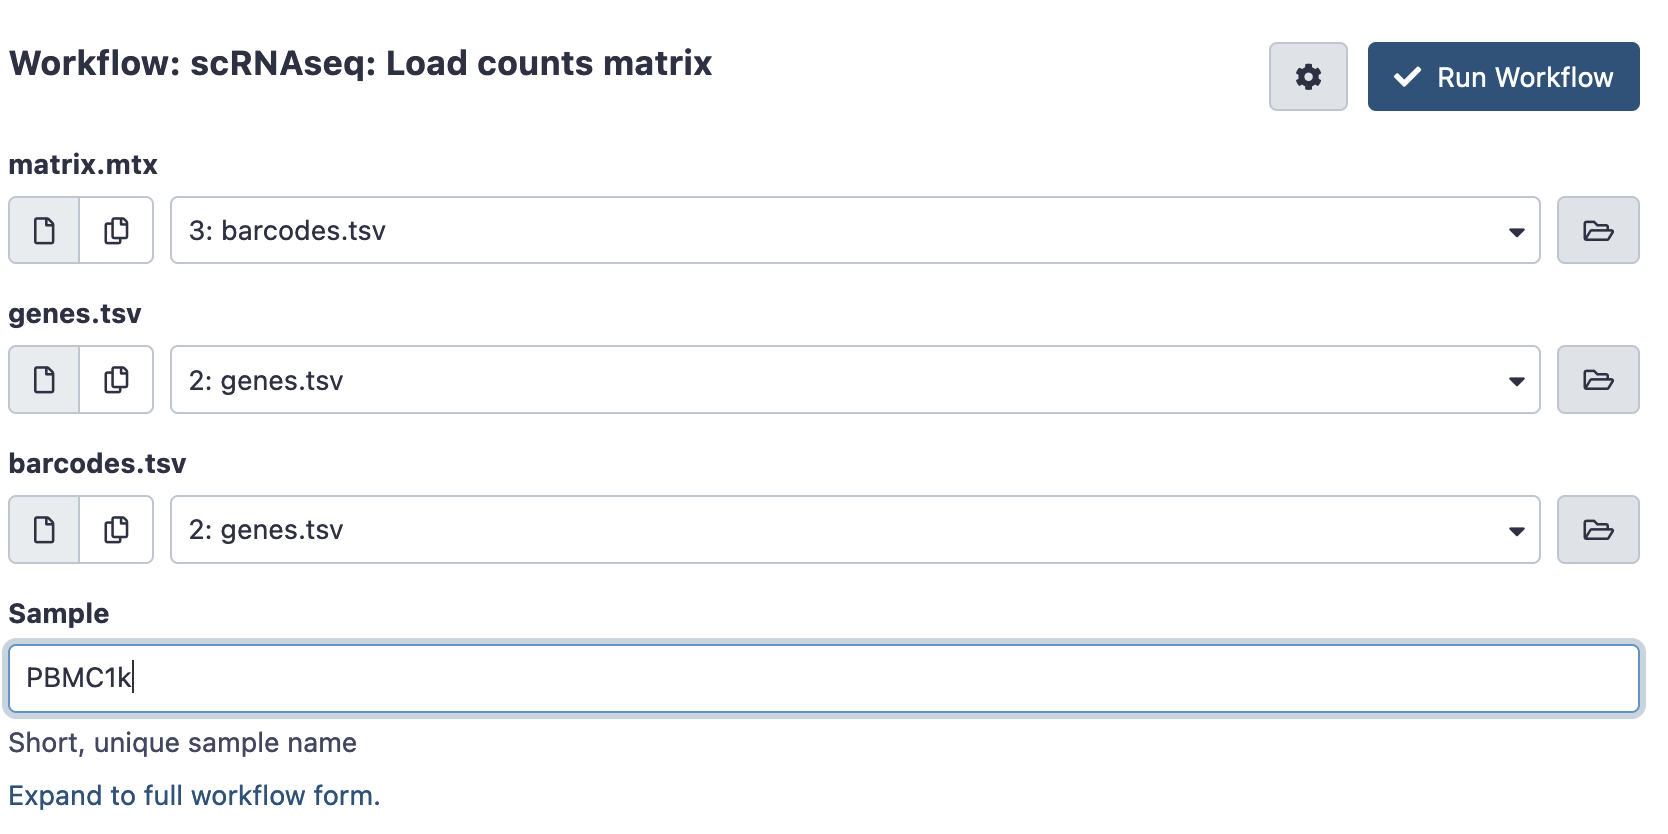
If you have a counts matrix already you can instead run the Load counts matrix workflow. This will still convert it into an AnnData object for processing, and record the sample name.
- Load your input files into galaxy. The counts matrix is expected in a matrix market format, which consists of 3 files. It is a common format for single cell data, generated by tools like Cell Ranger or StarSOLO, and is often available for public datasets. Files may be gzipped (suffixed .gz), there is no need to uncompress them.
- matrix.mtx (.gz) : A file with the number of counts per cell
- genes.tsv (.gz) or features.tsv (.gz) : A file listing all the genes or features in the experiment
- barcodes.tsv (.gz) : A file listing the cellular barcodes in the experiment.
You may have a ‘filtered’ and a ‘raw’ set of counts matrices - generally, the ‘filtered’ set should be used. The raw set may include large numbers of barcodes with very low counts - real cells are expected to be in the ‘filtered’ set.
-
Import the Load counts matrix workflow (listed above)
-
Hit run to bring up the following launch form.
Once ready hit the ‘run workflow’ button. This pipeline should usually run quickly (less than an hour).
Combine multiple samples
Once you’ve loaded your data and built a counts matrix for each of your samples, you can combine them for downstream processing. Any of these 3 options outputs an AnnData object in you history - containing your counts and annotated with the sample name internally.
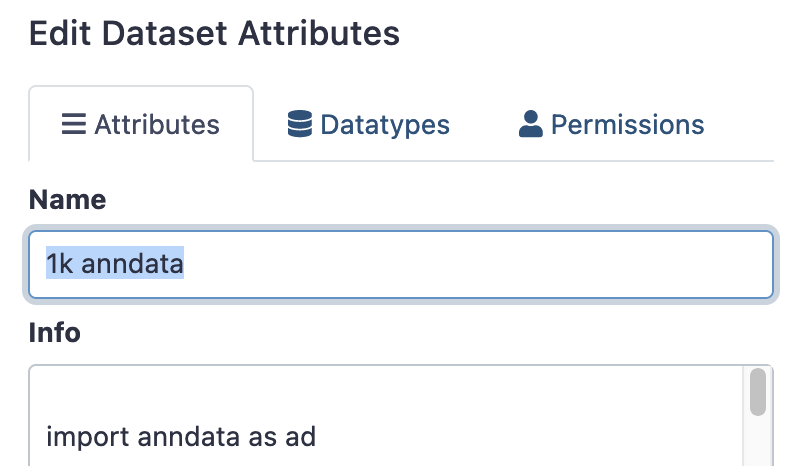
That object in your history will probably be named something like ‘Manipulate AnnData (add_annotation) on data 20 and data 17’. You may like to rename this object via the ‘edit attributes’ option in the history panel, so its easier to find later. (It may be easier to do this as you go)
Once there is a loaded anndata file for each sample, join all samples with the ‘Manipulate AnnData object’ Tool (search on the tools pane on the left).
This tool can do several different operations – listed under ‘Function to manipulate the object’, but we want the default; “Concatenate along the observation axis”. This combines cells (observations) from multiple sample runs.
Choose the AnnData object of one of your samples in the ‘Annotated data matrix’ dropdown. Then, choose the rest of your samples under ‘Annotated matrix to add’. Use ctrl-select / option-select to highlight multiple samples.
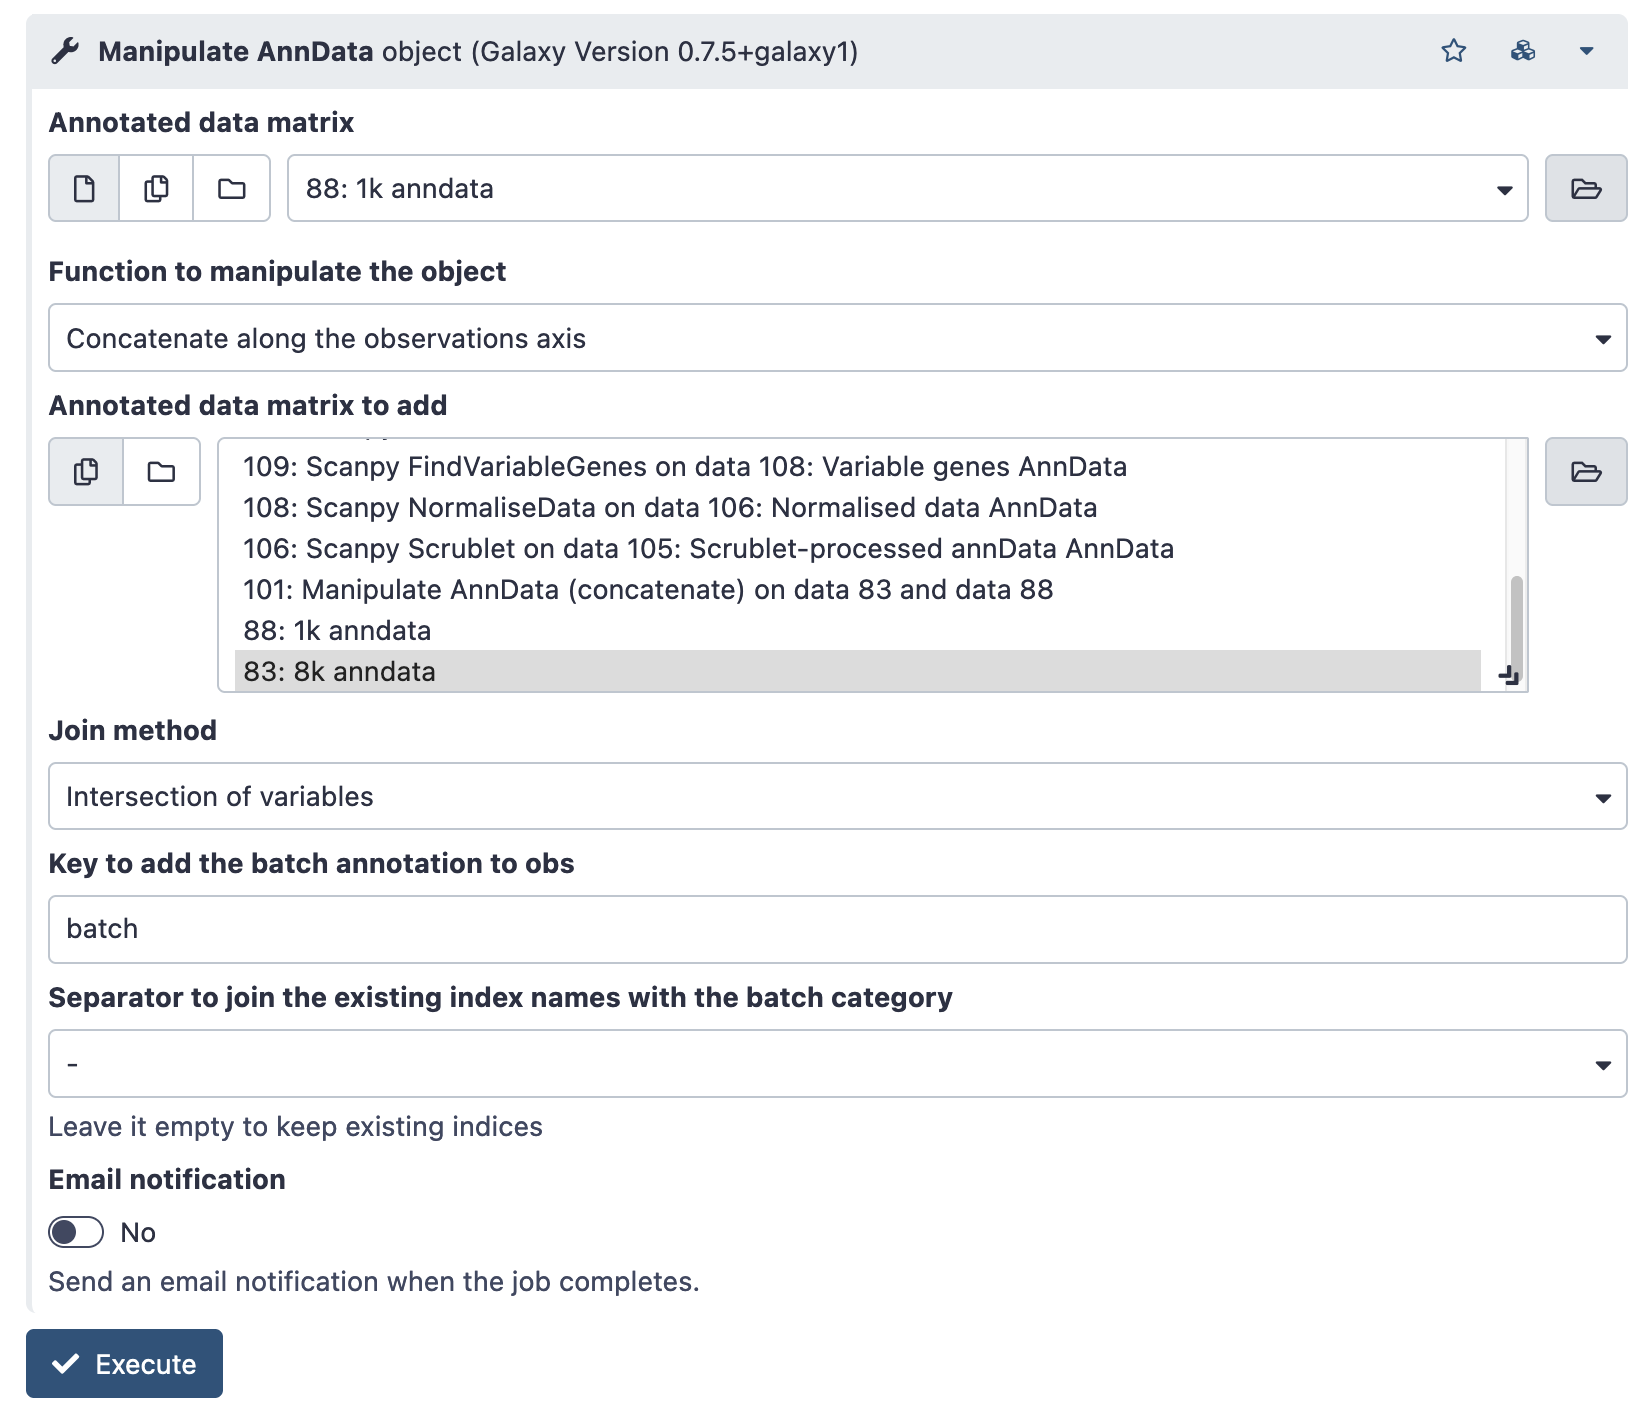
A combined AnnData object will created in your history.
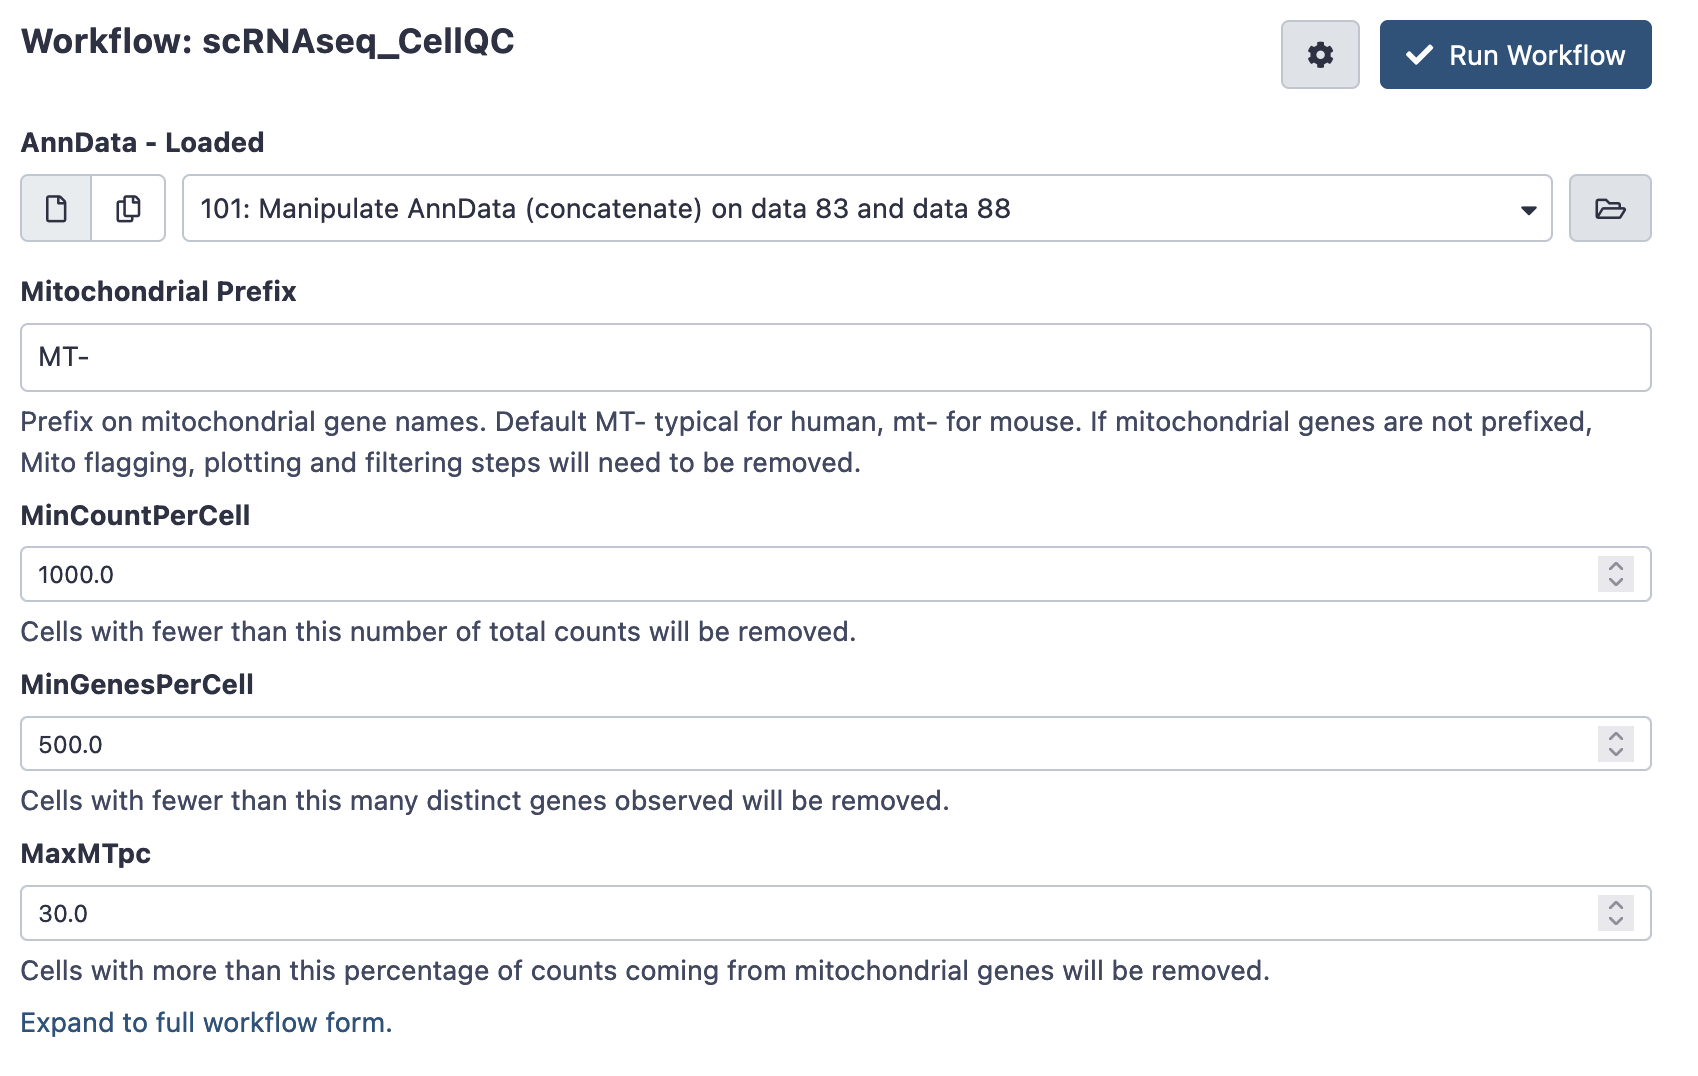
Run Cell QC
Launch workflow
Next, run the scRNAseq Cell QC workflow on your combined AnnData object. This workflow plots some basic cell-level QC thresholds, and applies the QC thresholds to produce a filtered AnnData object.
There are a number of QC thresholds, and it is very likely they’ll will need to be tuned. The defaults are a starting point, but note that there is no ideal threshold for minimum counts and genes per cell - thresholds vary wildly between technologies and experiment.
- Mitochondrial Prefix: Prefix on mitochondrial gene names. Default MT- typical for human, mt- for mouse. Using the wrong form will results in plotting errors - check your gene names if this occurs. If mitochondrial genes are not prefixed, mitochondrial flagging, plotting and filtering steps will need to be removed - else they’ll generated errors.
- Min Count Per Cell: Cells with fewer than this number of total counts will be removed. Check your QC plots to make sure your thresholds are reasonable!
- Min Genes Per Cell: Cells with fewer than this many distinct genes observed will be removed. Again, check your QC plots to make sure your thresholds are reasonable!
- MaxMTpc : Cells with more than this percentage of counts coming from mitochondrial genes will be removed. Generally high MT-content cells are uninteresting, but again, the threshold can differ between experiments.
Inspect results
Once your workflow has had time to run (minutes to hours), return to galaxy and look up its ‘invocation’. Each workflow run is an invocation.
Data Menu > Workflow Invocations
This brings up the history of workflow invocations, and their reports. Click the left arrow to expand the relevant workflow run, and the ‘view report’ button will bring up the workflow report.
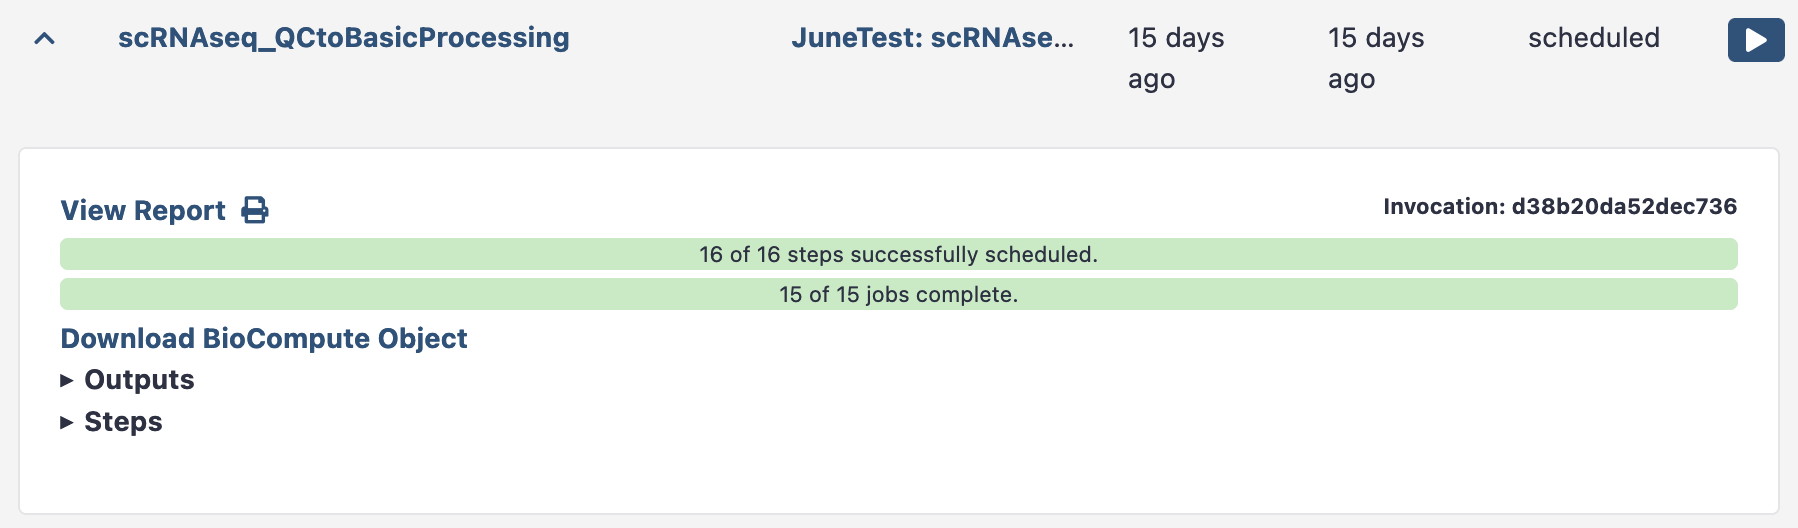
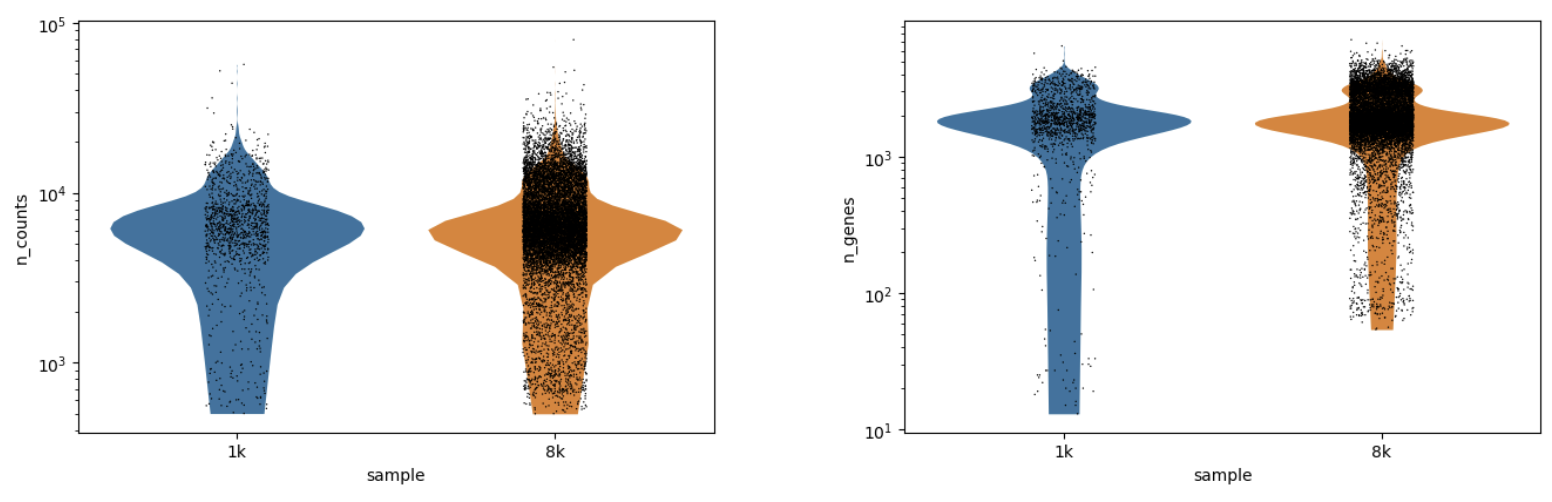
This Cell QC workflow report shows the cell level QC plots. You’ll notice you can see each sample plotted separately in the QC plots. You can now elect to rerun this workflow with tweaked thresholds (e.g. higher minimum counts threshold) once you’ve seen this output.
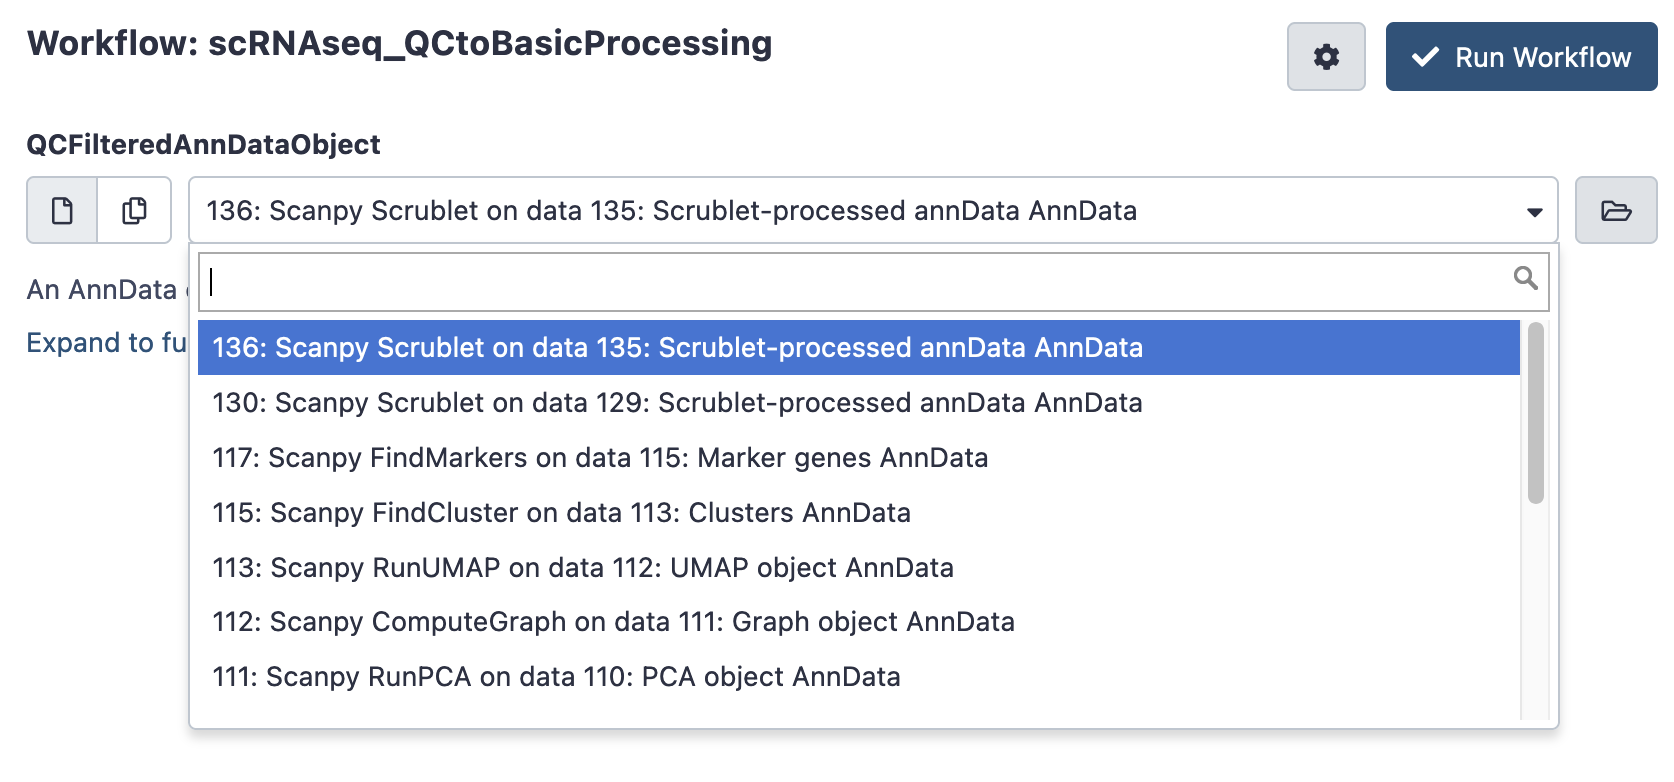
Run QC to Basic processing
Launch workflow
If you are happy with the filtering thresholds, you can launch the next workflow, scRNAseq QC to Basic Processing to do some routine single cell calculations. It only asks for the filtered AnnData Object (typically the last AnnData in you history, which may be named something like ‘scanpy scrublet on data x’). This takes a few minutes to hours to run.
Inspect results
Once again, after your workflow has finished, return to galaxy and look up its ‘invocation’.
Data Menu > Workflow Invocations
The QC to Basic Processing workflow report shows the subsequent UMAP, clustering and marker information. Includes links to download the processed AnnData object for downstream work.
The resultant AnnData object contains this UMAP and clustering analysis.
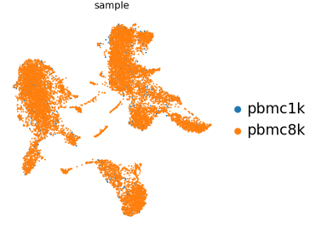
E.g. The first umap in the report shows the different samples that make up the data.
Next steps
The AnnData object generated by these workflows is intended for further analysis. Options include
- CellXene : CellXgene is a tool for browsing and exploring single cell data. It use the AnnData object, and all of the annotation stored within it (expression, clusters, sample names). See CellXgene documentation, and a user guide. This can be launched within galaxy.
- Scanpy : Scanpy is a python based suite of tool for working with single cell data.
- Many scanpy functions are available within galaxy (and are used within this workflow). Explore the galaxy scRNAseq tutorials for more information
- Or, you download your AnnData object and work with the scanpy toolkit directly, using python on your computer or other server. This can provide more fine-grained control of your analysis. There are many tutorials to work from.
Note that there are toolkits other than scanpy (e.g. Seurat, SingleCellExperiment objects) which are not directly compatible without conversions.
Note that the Cell Ranger tool will also output a ‘.cloupe’ file, which may be used with the ‘cell loupe’ desktop program. If you download the .cloupe file, you’ll need to change its file ending from .binary to .cloupe. It is hidden by default within these workflows.
Licenses
Cell Ranger is proprietry software form 10X, and is only useable on galaxy australia once you have applied for access - see Getting access to cell ranger
An alternative option is the STARsolo, distributed under an MIT license.
Otherwise, usage of these workflows is dependant on the (generally permissive) licenses of the underlying tools and platforms; including;
Getting access to Cell Ranger
When you first log in to Galaxy, the Cell Ranger tool with not be visible.
Cell Ranger is subject to a custom license. Most notably, it can only be used with 10X technology.
To get access on your account, apply here (simply requires agreeing to the licence): https://site.usegalaxy.org.au/request/access/cellranger
Once successful, Cell Ranger will appear in your tool list under MISCELLANEOUS TOOLS > Local Tools Once you receive a confirmation email, you may need to log out and log back in for it to take effect.
Finding help
For general galaxy training, see the Galaxy Training Network
For error problems with galaxy tools on galaxy australia - please check out the error debugging guide and use the built-in bug reporting functionality. Or, for more general or involved galaxy help try the galaxy help forum.
To get in contact with problems you find specifically with this workflow; please report a ticket on this github repository