Dataset: IBD cosMX GarridoTrigo2023
Sarah Williams
Data is from paper Macrophage and neutrophil heterogeneity at single-cell spatial resolution in human inflammatory bowel disease from Garrido-Trigo et al 2023, (Garrido-Trigo et al. 2023)
The study included 9 cosmx slides of colonic biopsies
- 3x HC - Healthy controls
- 3x UC - Ulcerative colitis
- 3x CD - Chrones’s disease
Fastantically - not only have they made their raw and annotated data available, but have also shared their analysis code; https://github.com/HelenaLC/CosMx-SMI-IBD
They have also shared browseable interface here: https://servidor2-ciberehd.upc.es/external/garrido/app/
Libraries
library(Seurat)Loading required package: SeuratObjectLoading required package: sp'SeuratObject' was built with package 'Matrix' 1.6.5 but the current
version is 1.7.1; it is recomended that you reinstall 'SeuratObject' as
the ABI for 'Matrix' may have changed
Attaching package: 'SeuratObject'The following objects are masked from 'package:base':
intersect, tlibrary(SeuratObject)
library(tidyverse)── Attaching core tidyverse packages ──────────────────────── tidyverse 2.0.0 ──
✔ dplyr 1.1.4 ✔ readr 2.1.5
✔ forcats 1.0.0 ✔ stringr 1.5.1
✔ ggplot2 3.5.1 ✔ tibble 3.2.1
✔ lubridate 1.9.4 ✔ tidyr 1.3.1
✔ purrr 1.0.2 ── Conflicts ────────────────────────────────────────── tidyverse_conflicts() ──
✖ dplyr::filter() masks stats::filter()
✖ dplyr::lag() masks stats::lag()
ℹ Use the conflicted package (<http://conflicted.r-lib.org/>) to force all conflicts to become errorsData download
From the project description:
Raw data on GEO here; https://www.ncbi.nlm.nih.gov/geo/query/acc.cgi?acc=GSE234713
Inflammatory bowel diseases (IBDs) including ulcerative colitis (UC) and Crohn’s disease (CD) are chronic inflammatory diseases with increasing worldwide prevalence that show a perplexing heterogeneity in manifestations and response to treatment. We applied spatial transcriptomics at single-cell resolution (CosMx Spatial Molecular Imaging) to human inflamed and uninflamed intestine.
The following files were download from GEO
- GSE234713_CosMx_annotation.csv.gz
- GSE234713_CosMx_normalized_matrix.txt.gz
- GSE234713_RAW.tar: RAW data was downloaded via custom downlod in 3
batches, one per group
- GSE234713_RAW_CD.tar
- GSE234713_RAW_HC.tar
- GSE234713_RAW_UC.tar
- GSE234713_ReadMe_SMI_Data_File.html
The polygon files defining the cell outlines were provided separately. Typically these would be included with the other files.
- CD_a.csv : A .csv file which defines the outline of every cell. One file per slide.
cd raw_data
tar -xf GSE234713_RAW_CD.tar
tar -xf GSE234713_RAW_HC.tar
tar -xf GSE234713_RAW_UC.tar
Data load
dataset_dir      <- '~/projects/spatialsnippets/datasets/'
project_data_dir <- file.path(dataset_dir,'GSE234713_IBDcosmx_GarridoTrigo2023')
sample_dir            <- file.path(project_data_dir, "raw_data_for_sfe/")
annotation_file       <- file.path(project_data_dir,"GSE234713_CosMx_annotation.csv.gz")
data_dir              <- file.path(project_data_dir, "processed_data/")


seurat_file_00_raw    <- file.path(data_dir, "GSE234713_CosMx_IBD_seurat_00_raw.RDS")
seurat_file_01_loaded <- file.path(data_dir, "GSE234713_CosMx_IBD_seurat_01_loaded.RDS")

# config
min_count_per_cell <- 100
max_pc_negs        <- 1.5
max_avg_neg        <- 0.5

sample_codes <- c(HC="Healthy controls",UC="Ulcerative colitis",CD="Crohn's disease")
Raw data
Load data
# Load LoadNanostring.X for keeping metadata e.t.c
source('/home/s.williams/projects/loadnanostring/code/LoadNanostring.R')


load_sample_into_seurat <- function(the_sample){

  # Using a modified version of the LoadNanostring function, which keeps metadata, and loads a litte more effiently for large datasets (which is not this one.)
  # ..../datasets//GSE234713_IBDcosmx_GarridoTrigo2023/raw_data_for_sfe//GSM7473682_HC_a
  so <- LoadNanostring.X(file.path(sample_dir, the_sample),
                         project = the_sample,
                         assay='RNA',
                         fov=the_sample, tempdir= '~/tmp')

  # sample info
  so$individual_code <- factor(substr(so$orig.ident,12,16))
  so$tissue_sample   <- factor(substr(so$orig.ident,12,16))
  so$group     <- factor(substr(the_sample, 12, 13), levels=names(sample_codes))
  so$condition <- factor(as.character(sample_codes[so$group]), levels=sample_codes)

  so$fov_name        <- paste0(so$individual_code,"_", str_pad(so$fov, 3, 'left',pad='0'))


  # Put neg probes into their own assay.
  neg_probes <- rownames(so)[grepl(x=rownames(so), pattern="NegPrb")]
  neg_matrix         <- GetAssayData(so,assay = 'RNA', layer = 'counts')[neg_probes,]
  #so[["negprobes"]] <- CreateAssayObject(counts = neg_matrix)
  so[["negprobes"]] <- CreateAssay5Object(counts = neg_matrix)

  ## and remove from the main one
  rna_probes  <- rownames(so)[(! rownames(so) %in% neg_probes)]
  so[['RNA']] <- subset( so[['RNA']],features = rna_probes)


  return(so)

}
samples <- c('GSM7473682_HC_a','GSM7473683_HC_b','GSM7473684_HC_c',
'GSM7473685_UC_a','GSM7473686_UC_b','GSM7473687_UC_c',
'GSM7473688_CD_a','GSM7473689_CD_b','GSM7473690_CD_c')
sample_prefix <- paste0(substr(samples, 12,15))so.list <- lapply(FUN=load_sample_into_seurat, X=samples)
#NB: merge is in SeuratObject packages, but must be called without ::
options(future.globals.maxSize= 10*1024^3) # 10G.
so.raw <- merge(so.list[[1]], y=so.list[2:length(so.list)], add.cell.ids=sample_prefix)
#Error in getGlobalsAndPackages(expr, envir = envir, globals = globals) :
# The total size of the 8 globals exported for future expression (‘FUN()’) is 5.90 GiB.. This exceeds the maximum #allowed size of 500.00 MiB (option 'future.globals.maxSize'). The three largest globals are ‘FUN’ (5.90 GiB of #class ‘function’), ‘p’ (25.22 KiB of class ‘function’) and ‘slot<-’ (1.36 KiB of class ‘function’)
rm(so.list)
# save
saveRDS(so.raw, seurat_file_00_raw)# load previously saved.
so.raw <- readRDS(seurat_file_00_raw)Negative probe handling
so.raw$pc_neg <-  ( so.raw$nCount_negprobes / so.raw$nCount_RNA ) * 100

so.raw[["negprobes"]] <- JoinLayers(so.raw[["negprobes"]]) # For caluclating these, need to have the negprobes merged
so.raw$avg_neg <-  colMeans(so.raw[["negprobes"]])   # only defined firsts sample.
Warning: data layer is not found and counts layer is usedPull in annotation
Most cell annotations.
anno_table <- read_csv(annotation_file)Rows: 463967 Columns: 3
── Column specification ────────────────────────────────────────────────────────
Delimiter: ","
chr (3): id, subset, SingleR2
ℹ Use `spec()` to retrieve the full column specification for this data.
ℹ Specify the column types or set `show_col_types = FALSE` to quiet this message.anno_table <- as.data.frame(anno_table)
rownames(anno_table) <- anno_table$id
head(so.raw@meta.data) orig.ident nCount_RNA nFeature_RNA fov cell_ID Area AspectRatio
HC_a_1_1 GSM7473682_HC_a 366 187 1 1 6153 0.67
HC_a_2_1 GSM7473682_HC_a 805 283 1 2 16178 0.85
HC_a_3_1 GSM7473682_HC_a 118 73 1 3 3119 1.52
HC_a_4_1 GSM7473682_HC_a 106 59 1 4 3988 1.52
HC_a_5_1 GSM7473682_HC_a 462 207 1 5 4773 0.53
HC_a_6_1 GSM7473682_HC_a 1314 436 1 6 11588 0.87
CenterX_local_px CenterY_local_px CenterX_global_px CenterY_global_px
HC_a_1_1 2119 3443 19274.56 173198.6
HC_a_2_1 1847 3404 19002.56 173159.6
HC_a_3_1 1986 3458 19141.56 173213.6
HC_a_4_1 2362 3454 19517.56 173209.6
HC_a_5_1 2159 3415 19314.56 173170.6
HC_a_6_1 1664 3402 18819.56 173157.6
Width Height Mean.MembraneStain Max.MembraneStain Mean.PanCK Max.PanCK
HC_a_1_1 79 118 680 2218 17170 29735
HC_a_2_1 137 161 615 4453 16775 29702
HC_a_3_1 79 52 989 2827 24033 29662
HC_a_4_1 91 60 449 2099 13575 29651
HC_a_5_1 63 118 1002 2425 24946 29670
HC_a_6_1 116 134 1024 2320 25700 29712
Mean.CD45 Max.CD45 Mean.CD3 Max.CD3 Mean.DAPI Max.DAPI cell
HC_a_1_1 198 9639 234 1237 20 131 1_1
HC_a_2_1 222 21371 234 1520 12 122 2_1
HC_a_3_1 171 6858 298 1721 13 58 3_1
HC_a_4_1 146 935 206 1402 6 56 4_1
HC_a_5_1 299 6387 330 1443 22 116 5_1
HC_a_6_1 354 23243 328 1610 23 113 6_1
individual_code tissue_sample group condition fov_name
HC_a_1_1 HC_a HC_a HC Healthy controls HC_a_001
HC_a_2_1 HC_a HC_a HC Healthy controls HC_a_001
HC_a_3_1 HC_a HC_a HC Healthy controls HC_a_001
HC_a_4_1 HC_a HC_a HC Healthy controls HC_a_001
HC_a_5_1 HC_a HC_a HC Healthy controls HC_a_001
HC_a_6_1 HC_a HC_a HC Healthy controls HC_a_001
nCount_negprobes nFeature_negprobes pc_neg avg_neg
HC_a_1_1 2 2 0.5464481 0.10526316
HC_a_2_1 5 3 0.6211180 0.26315789
HC_a_3_1 1 1 0.8474576 0.05263158
HC_a_4_1 0 0 0.0000000 0.00000000
HC_a_5_1 3 2 0.6493506 0.15789474
HC_a_6_1 8 5 0.6088280 0.42105263head(anno_table) id subset SingleR2
HC_c_2_1 HC_c_2_1 stroma Pericytes
HC_c_3_1 HC_c_3_1 stroma Endothelium
HC_c_4_1 HC_c_4_1 stroma Pericytes
HC_c_5_1 HC_c_5_1 epi Secretory progenitor
HC_c_7_1 HC_c_7_1 myeloids M2
HC_c_8_1 HC_c_8_1 epi Tuft cellsso.raw$full_cell_id <- as.character(rownames(so.raw@meta.data))
so.raw$celltype_subset <- factor(anno_table[so.raw$full_cell_id,]$subset)
so.raw$celltype_SingleR2 <- factor(anno_table[so.raw$full_cell_id,]$SingleR2)
so.raw$fov_name <- factor(so.raw$fov_name)
so.raw$group <- factor(so.raw$group, levels=c("CD","UC","HC"))
so.raw$condition <- factor(so.raw$condition, levels=c("Crohn's disease", 'Ulcerative colitis', 'Healthy controls'))
table(is.na(so.raw$celltype_subset))
 FALSE   TRUE
459145  21240
Basic QC filter
Min count per cell
ggplot(so.raw@meta.data, aes(x=nCount_RNA, col=orig.ident)) +
  geom_density() +
  geom_vline(xintercept = min_count_per_cell, lty=3) +
  scale_x_log10() +
  theme_bw() +
  ggtitle("Counts per cell")
Warning in scale_x_log10(): log-10 transformation introduced infinite values.Warning: Removed 17 rows containing non-finite outside the scale range
(`stat_density()`).
Percent Negative probes
ggplot(so.raw@meta.data, aes(x=pc_neg, col=orig.ident)) +
  geom_density() +
  geom_vline(xintercept = max_pc_negs, lty=3) +
  scale_x_log10() +
  theme_bw() +
  ggtitle("Negative probe composition")
Warning in scale_x_log10(): log-10 transformation introduced infinite values.Warning: Removed 227722 rows containing non-finite outside the scale range
(`stat_density()`).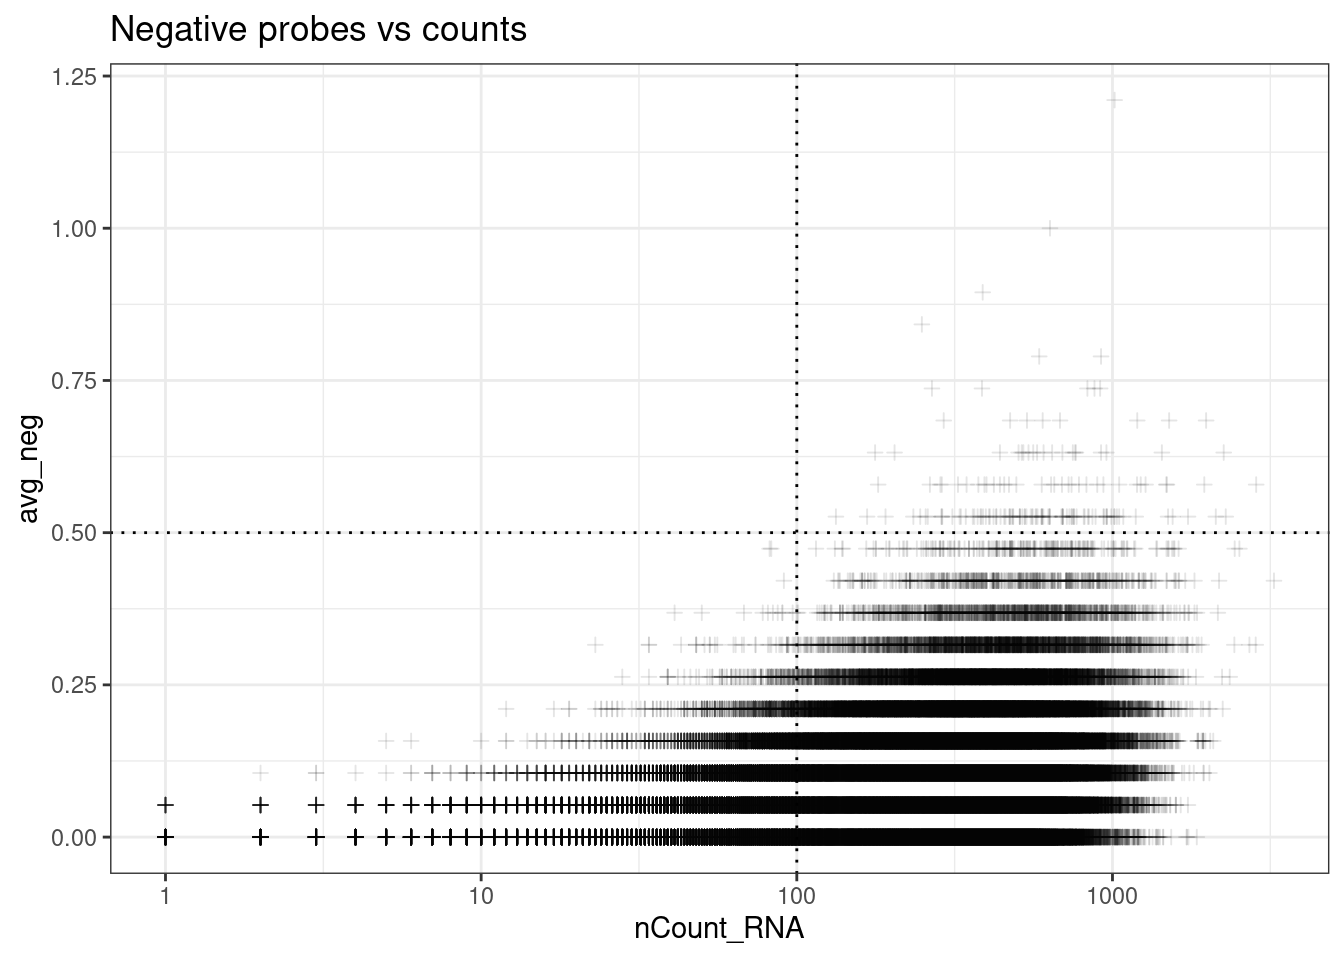
ggplot(so.raw@meta.data, aes(x=avg_neg, col=orig.ident)) +
  geom_density() +
  geom_vline(xintercept = max_avg_neg, lty=3) +
  theme_bw() +
  ggtitle("Negative probe average")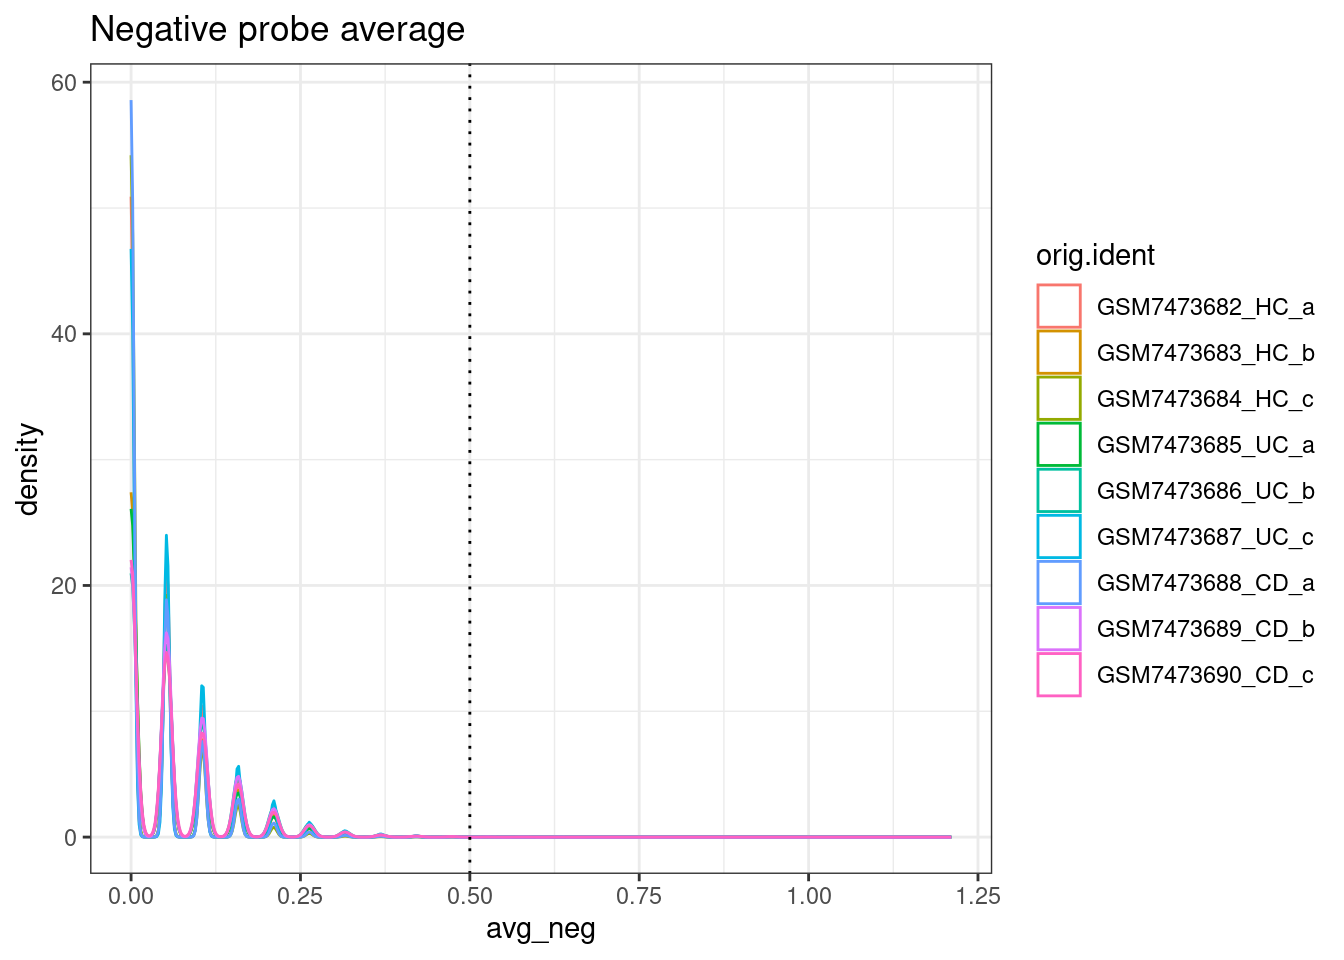
Use bottom right corner;
ggplot(so.raw@meta.data, aes(y=avg_neg, x=nCount_RNA)) +
  geom_point(pch=3, alpha=0.1) +
  geom_hline(yintercept = max_avg_neg, lty=3) +
  geom_vline(xintercept = min_count_per_cell, lty=3) +
  scale_x_log10() +
  theme_bw() +
  ggtitle("Negative probes vs counts")
Warning in scale_x_log10(): log-10 transformation introduced infinite values.
Apply filteres
From paper: “Cells with an average negative control count greater than 0.5 and less than 20 detected features were filtered out.”
Also remove cell with no cell type annotations.
###so.raw <- JoinLayers(so.raw)

so <- so.raw[ ,so.raw$nCount_RNA >= min_count_per_cell &
               so.raw$avg_neg <= max_avg_neg &
               !(is.na(so.raw$celltype_subset) )]
Warning: Not validating FOV objectsWarning: Not validating Centroids objects
Not validating Centroids objectsWarning: Not validating FOV objectsWarning: Not validating Centroids objectsWarning: Not validating FOV objects
Not validating FOV objects
Not validating FOV objectsWarning: Not validating Seurat objectsWarning: Not validating FOV objectsWarning: Not validating Centroids objects
Not validating Centroids objectsWarning: Not validating FOV objectsWarning: Not validating Centroids objectsWarning: Not validating FOV objects
Not validating FOV objects
Not validating FOV objectsWarning: Not validating Seurat objectsncol(so.raw)[1] 480385ncol(so)[1] 353239so <- readRDS(seurat_file_01_loaded)How many cells per sample?
table(so@meta.data$orig.ident)
GSM7473682_HC_a GSM7473683_HC_b GSM7473684_HC_c GSM7473685_UC_a GSM7473686_UC_b
          30356           46142           15420           44028           59901
GSM7473687_UC_c GSM7473688_CD_a GSM7473689_CD_b GSM7473690_CD_c
          38310           14469           69114           35499
Basic preprocessing
num_dims <- 15
# Run through preprocessing
so <- NormalizeData(so)

## Do per sample to mimic paper approach somewhat.
so <- FindVariableFeatures(so, nfeatures = 200)


so <- ScaleData(so) # Just 2k variable features
so <- RunPCA(so, features = VariableFeatures(so))
so <- RunUMAP(so, dims=1:num_dims)
so <- FindNeighbors(so, dims = 1:num_dims)
so <- FindClusters(so)
Basic plots
UMAP
Sample
DimPlot(so, group.by = 'orig.ident')Rasterizing points since number of points exceeds 100,000.
To disable this behavior set `raster=FALSE`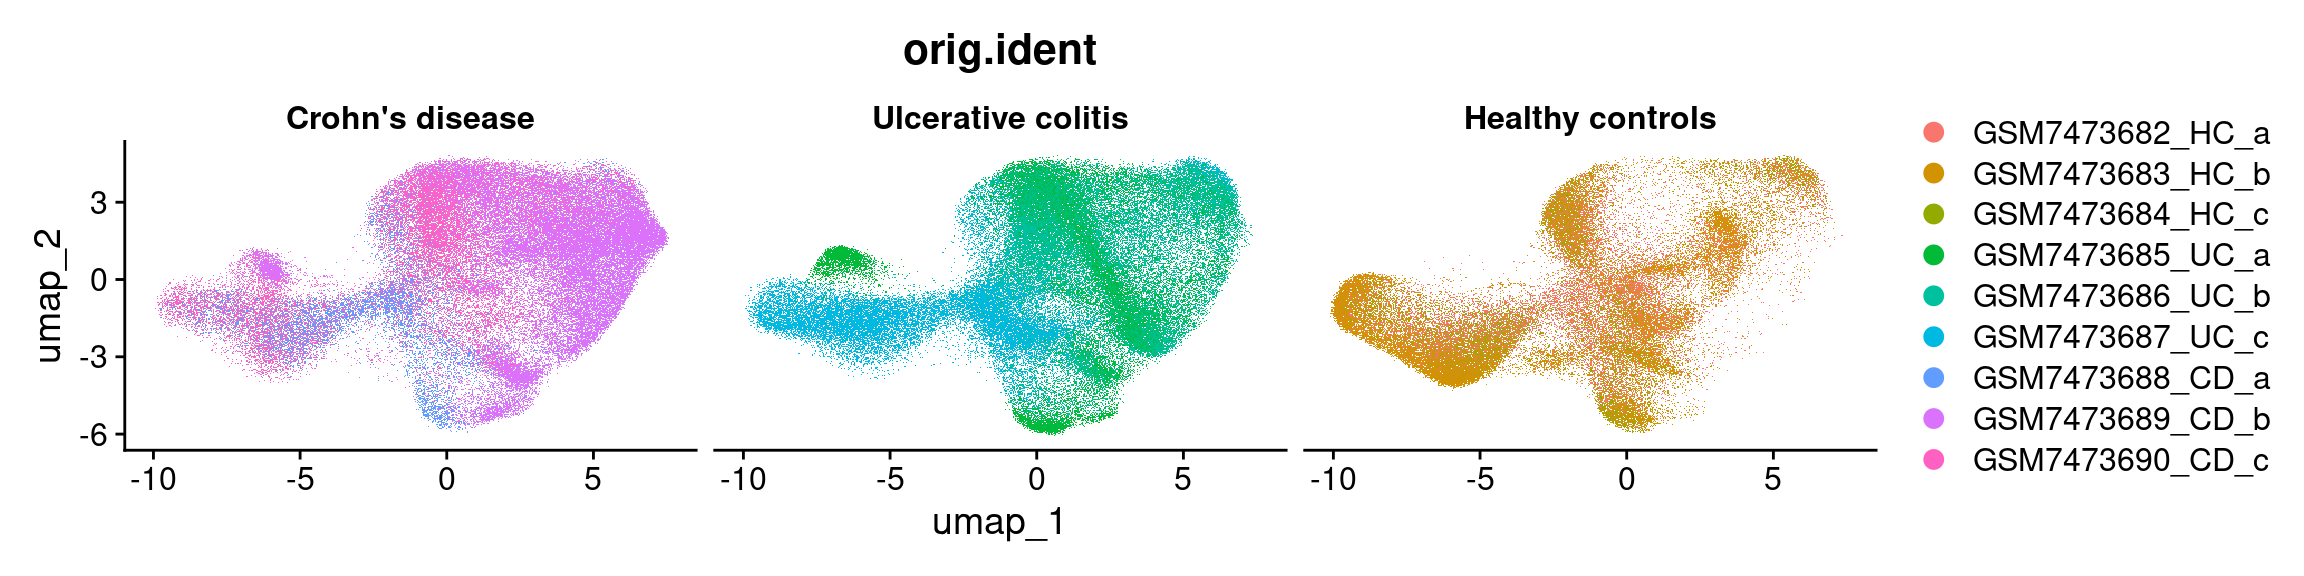
Condition
DimPlot(so, group.by = 'condition')Rasterizing points since number of points exceeds 100,000.
To disable this behavior set `raster=FALSE`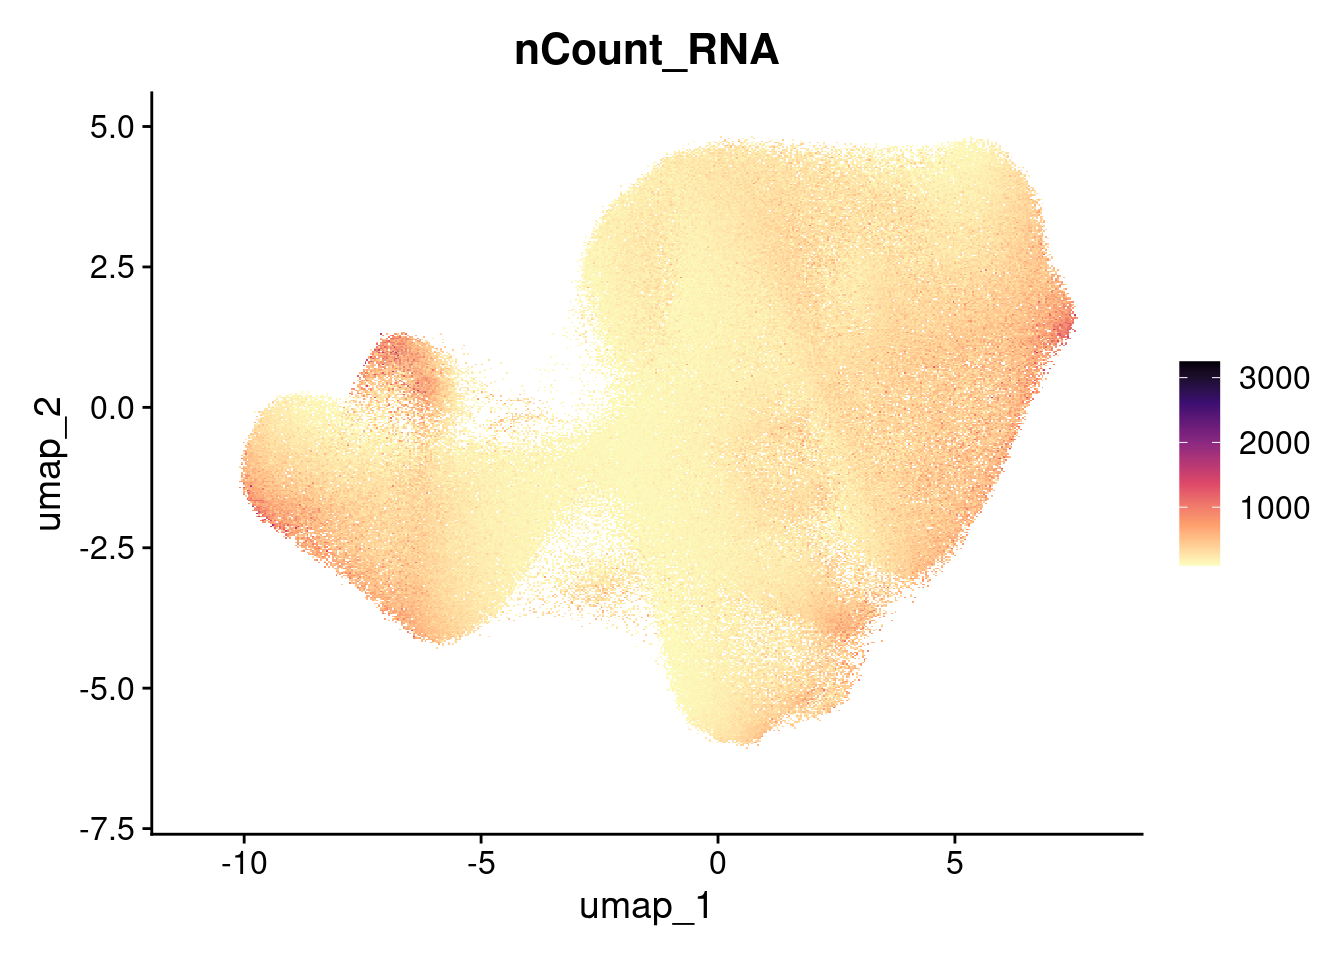
Condition X Sample
DimPlot(so, group.by = 'orig.ident',split.by = "condition")Rasterizing points since number of points exceeds 100,000.
To disable this behavior set `raster=FALSE`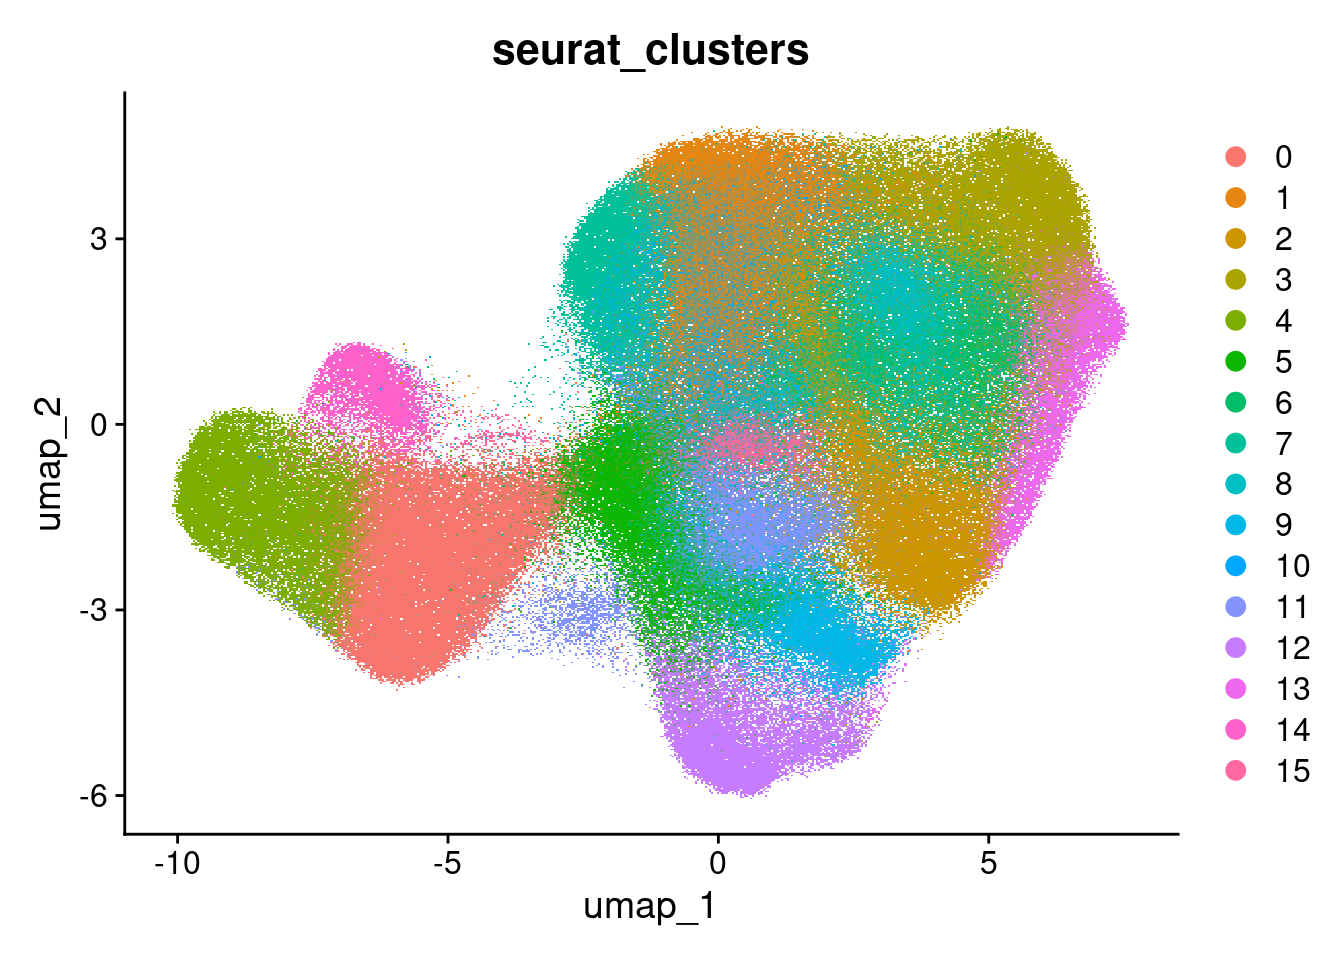
Total counts
FeaturePlot(so, 'nCount_RNA') + scale_colour_viridis_c(option="magma", direction = -1)Rasterizing points since number of points exceeds 100,000.
To disable this behavior set `raster=FALSE`Scale for colour is already present.
Adding another scale for colour, which will replace the existing scale.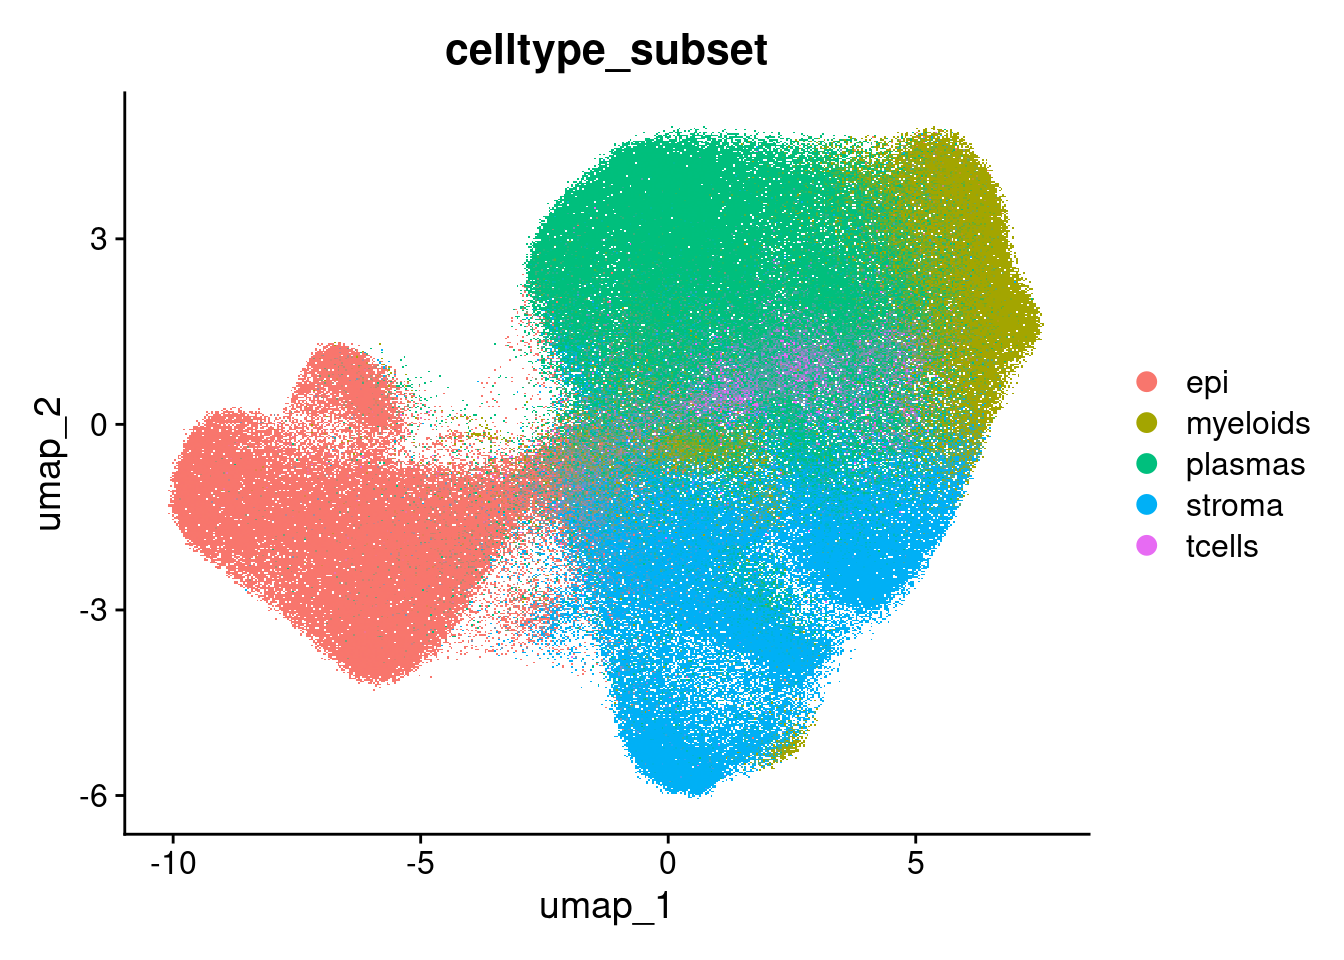
Clustered
DimPlot(so, group.by = 'seurat_clusters')Rasterizing points since number of points exceeds 100,000.
To disable this behavior set `raster=FALSE`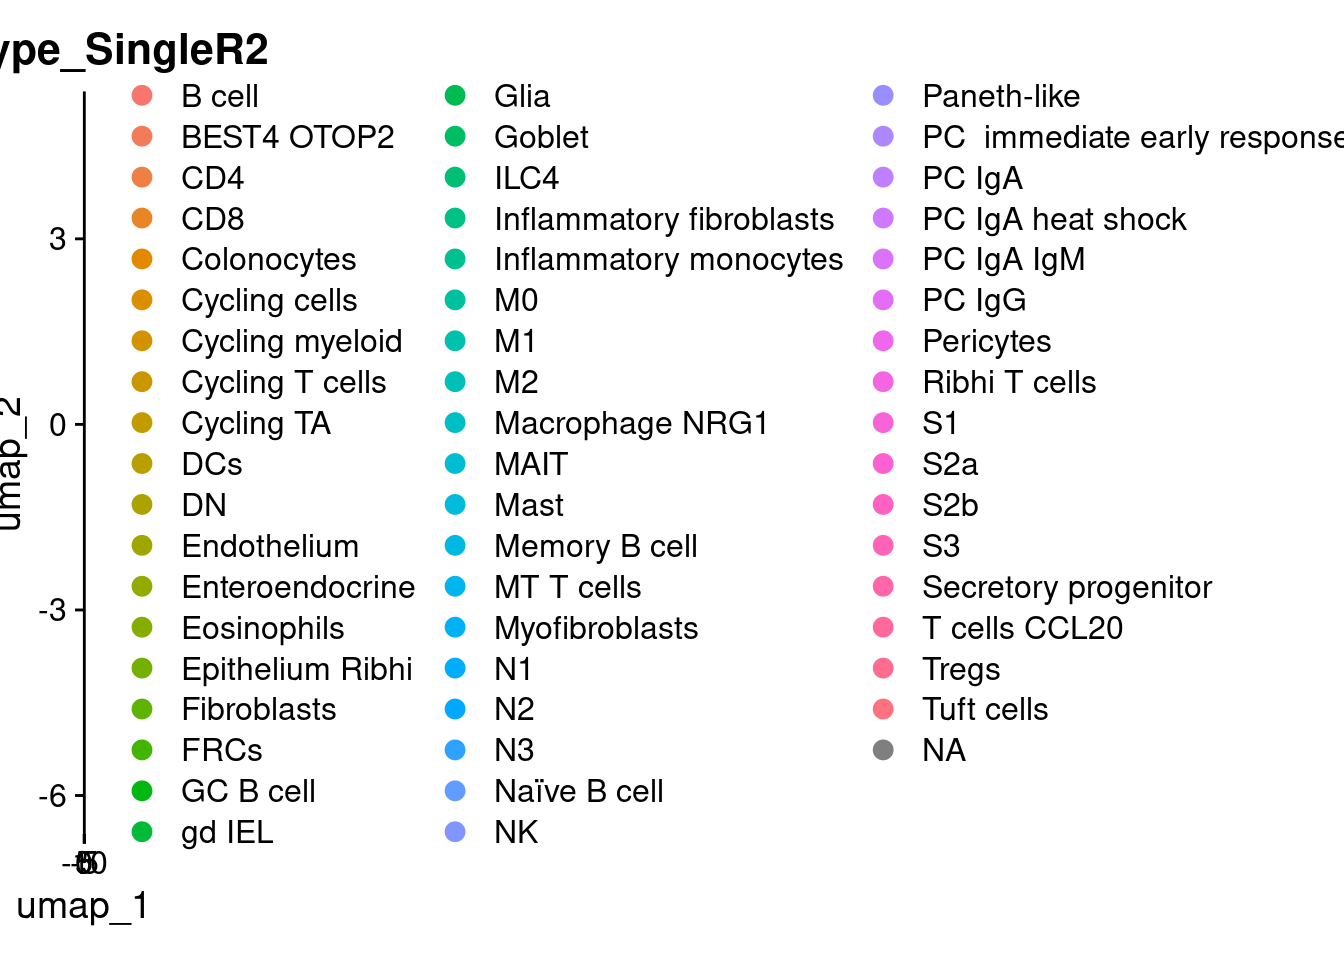
celltype_subset
Classifications from Garrido-Trigo et al 2023.
DimPlot(so, group.by = 'celltype_subset')Rasterizing points since number of points exceeds 100,000.
To disable this behavior set `raster=FALSE`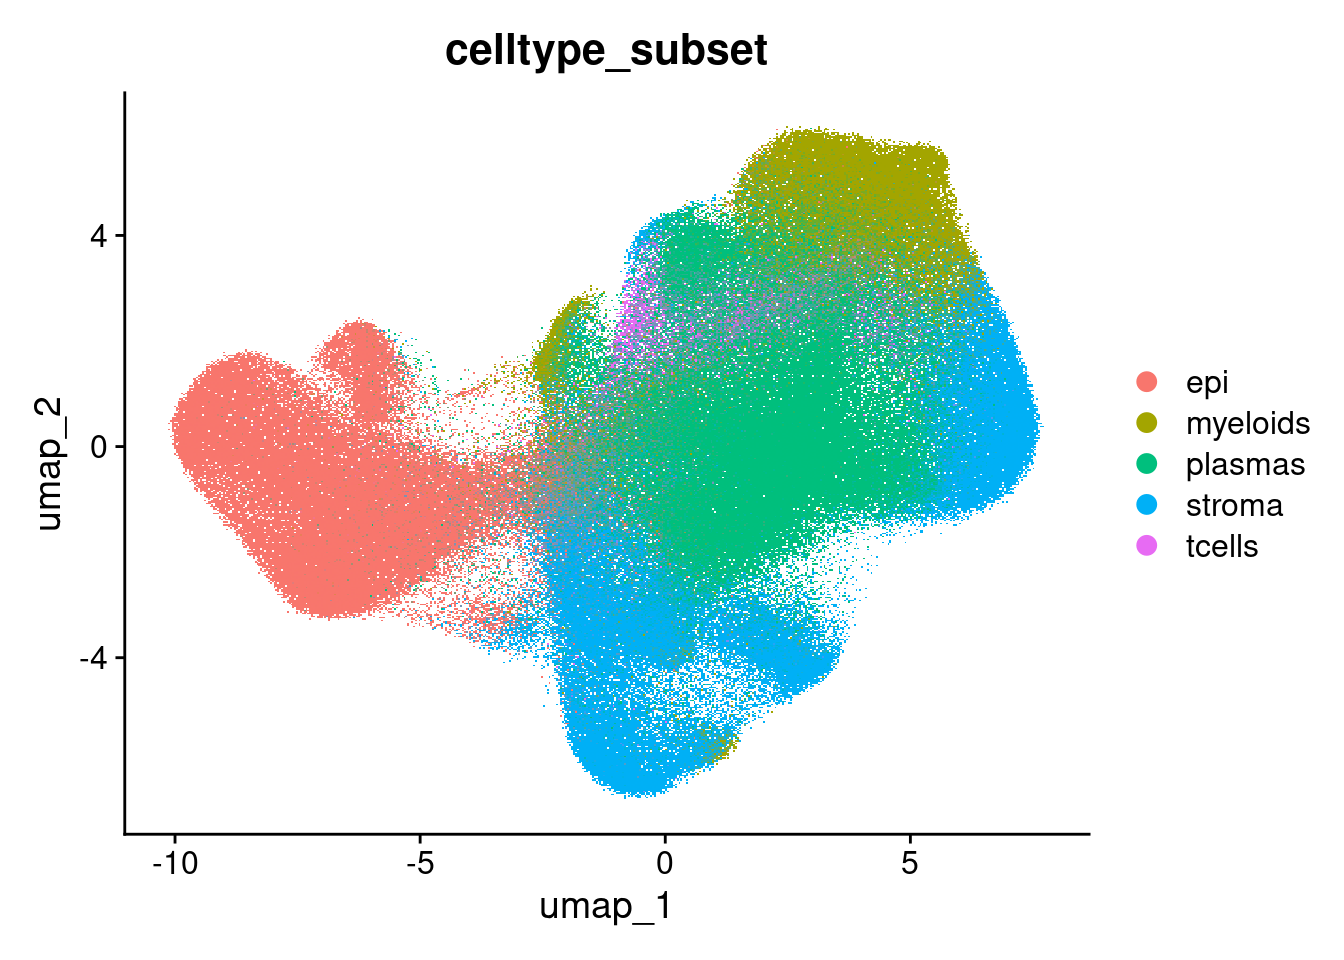

Clustering
Double checking the clusters line up with annotaiaon
table(so$celltype_subset)
     epi myeloids  plasmas   stroma   tcells
   82558    43916   130386    84654    11725
table(so$celltype_SingleR2)
                      B cell                  BEST4 OTOP2
                        5304                        10122
                         CD4                          CD8
                        2729                         2879
                 Colonocytes                Cycling cells
                       17651                         2105
             Cycling myeloid              Cycling T cells
                        1286                          322
                  Cycling TA                          DCs
                        1836                         1468
                          DN                  Endothelium
                         607                        13773
             Enteroendocrine                  Eosinophils
                         847                          191
            Epithelium Ribhi                  Fibroblasts
                        4357                         1665
                        FRCs                    GC B cell
                       10001                         3554
                      gd IEL                         Glia
                         366                         4337
                      Goblet                         ILC4
                        8837                          115
    Inflammatory fibroblasts       Inflammatory monocytes
                       12571                         1730
                          M0                           M1
                        2989                          934
                          M2              Macrophage NRG1
                       21269                         9575
                        MAIT                         Mast
                        1230                         2929
               Memory B cell                   MT T cells
                        7022                          175
              Myofibroblasts                           N1
                       16628                          544
                          N2                           N3
                         425                          576
                Naïve B cell                           NK
                        8894                          240
                 Paneth-like PC  immediate early response
                        1810                         9797
                      PC IgA            PC IgA heat shock
                        1294                         5077
                  PC IgA IgM                       PC IgG
                       12181                        75156
                   Pericytes                Ribhi T cells
                        9262                           86
                          S1                          S2a
                        5206                         3550
                         S2b                           S3
                        4596                         3065
        Secretory progenitor                T cells CCL20
                       34636                          816
                       Tregs                   Tuft cells
                        2160                         2462
Composition
heatmap(table(so$celltype_subset,so$celltype_SingleR2))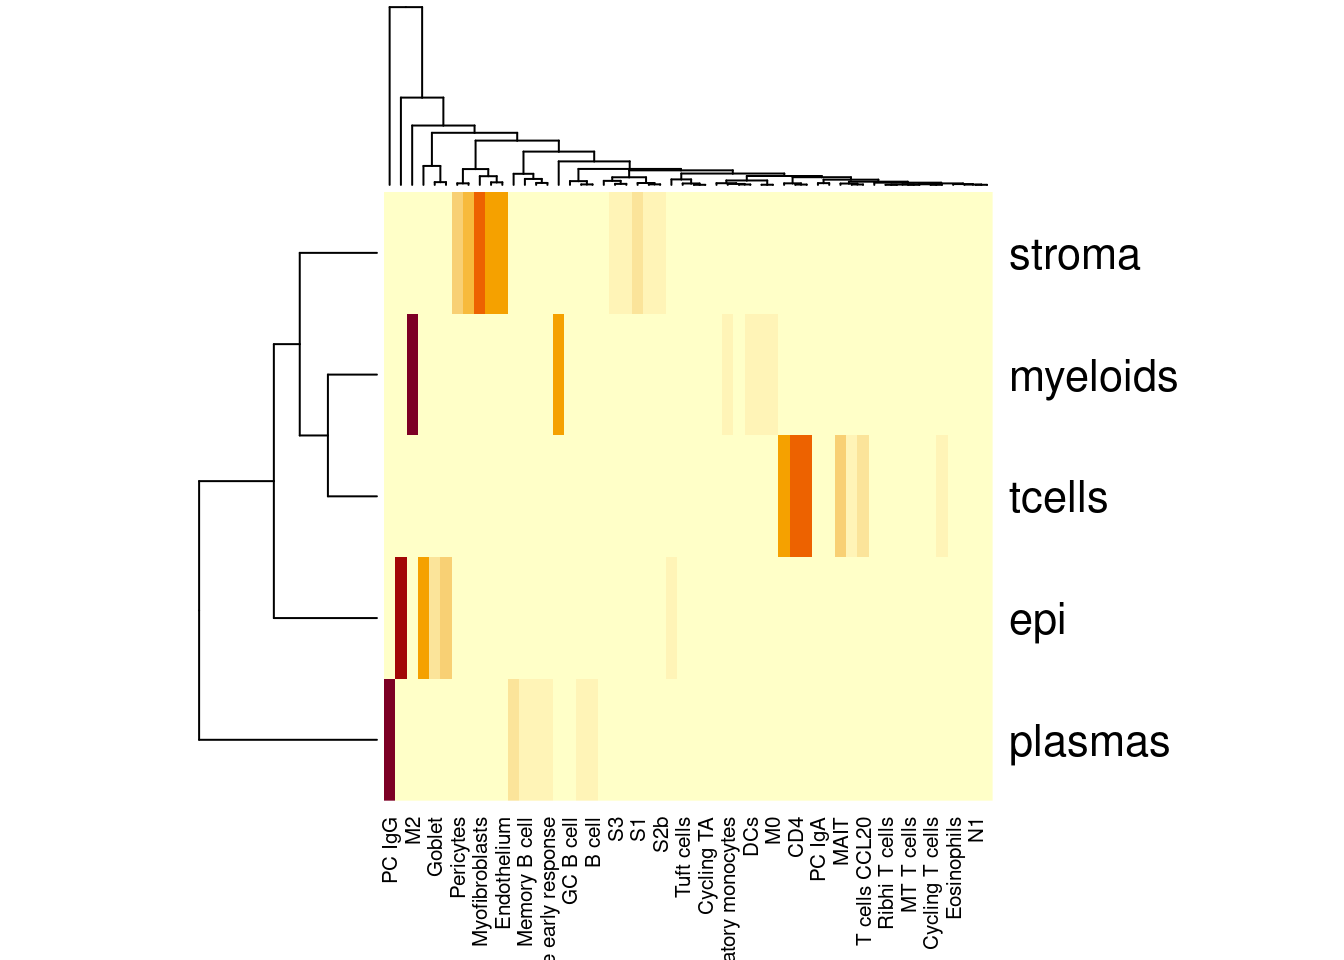
Save data
saveRDS(so, seurat_file_01_loaded)
sessionInfo()R version 4.4.0 (2024-04-24)
Platform: x86_64-pc-linux-gnu
Running under: Ubuntu 22.04.5 LTS
Matrix products: default
BLAS: /usr/lib/x86_64-linux-gnu/openblas-pthread/libblas.so.3
LAPACK: /usr/lib/x86_64-linux-gnu/openblas-pthread/libopenblasp-r0.3.20.so; LAPACK version 3.10.0
locale:
[1] LC_CTYPE=en_AU.UTF-8 LC_NUMERIC=C
[3] LC_TIME=en_AU.UTF-8 LC_COLLATE=en_AU.UTF-8
[5] LC_MONETARY=en_AU.UTF-8 LC_MESSAGES=en_AU.UTF-8
[7] LC_PAPER=en_AU.UTF-8 LC_NAME=C
[9] LC_ADDRESS=C LC_TELEPHONE=C
[11] LC_MEASUREMENT=en_AU.UTF-8 LC_IDENTIFICATION=C
time zone: Etc/UTC
tzcode source: system (glibc)
attached base packages:
[1] stats graphics grDevices datasets utils methods base
other attached packages:
[1] lubridate_1.9.4 forcats_1.0.0 stringr_1.5.1 dplyr_1.1.4
[5] purrr_1.0.2 readr_2.1.5 tidyr_1.3.1 tibble_3.2.1
[9] ggplot2_3.5.1 tidyverse_2.0.0 Seurat_5.2.1 SeuratObject_5.0.2
[13] sp_2.2-0 workflowr_1.7.1
loaded via a namespace (and not attached):
[1] RColorBrewer_1.1-3 rstudioapi_0.17.1 jsonlite_1.8.9
[4] magrittr_2.0.3 spatstat.utils_3.1-2 farver_2.1.2
[7] rmarkdown_2.29 fs_1.6.5 vctrs_0.6.5
[10] ROCR_1.0-11 spatstat.explore_3.3-4 htmltools_0.5.8.1
[13] sass_0.4.9 sctransform_0.4.1 parallelly_1.42.0
[16] KernSmooth_2.23-26 bslib_0.9.0 htmlwidgets_1.6.4
[19] ica_1.0-3 plyr_1.8.9 plotly_4.10.4
[22] zoo_1.8-12 cachem_1.1.0 whisker_0.4.1
[25] igraph_2.1.4 mime_0.12 lifecycle_1.0.4
[28] pkgconfig_2.0.3 Matrix_1.7-1 R6_2.5.1
[31] fastmap_1.2.0 fitdistrplus_1.2-2 future_1.34.0
[34] shiny_1.10.0 digest_0.6.37 colorspace_2.1-1
[37] patchwork_1.3.0 ps_1.8.1 rprojroot_2.0.4
[40] tensor_1.5 RSpectra_0.16-2 irlba_2.3.5.1
[43] labeling_0.4.3 progressr_0.15.1 timechange_0.3.0
[46] spatstat.sparse_3.1-0 httr_1.4.7 polyclip_1.10-7
[49] abind_1.4-8 compiler_4.4.0 bit64_4.6.0-1
[52] withr_3.0.2 fastDummies_1.7.5 MASS_7.3-64
[55] tools_4.4.0 lmtest_0.9-40 httpuv_1.6.15
[58] future.apply_1.11.3 goftest_1.2-3 glue_1.8.0
[61] callr_3.7.6 nlme_3.1-166 promises_1.3.2
[64] grid_4.4.0 Rtsne_0.17 getPass_0.2-4
[67] cluster_2.1.8 reshape2_1.4.4 generics_0.1.3
[70] gtable_0.3.6 spatstat.data_3.1-4 tzdb_0.4.0
[73] hms_1.1.3 data.table_1.16.4 spatstat.geom_3.3-5
[76] RcppAnnoy_0.0.22 ggrepel_0.9.6 RANN_2.6.2
[79] pillar_1.10.1 vroom_1.6.5 spam_2.11-1
[82] RcppHNSW_0.6.0 later_1.4.1 splines_4.4.0
[85] lattice_0.22-6 bit_4.5.0.1 renv_1.0.5
[88] survival_3.8-3 deldir_2.0-4 tidyselect_1.2.1
[91] miniUI_0.1.1.1 pbapply_1.7-2 knitr_1.49
[94] git2r_0.33.0 gridExtra_2.3 scattermore_1.2
[97] xfun_0.50 matrixStats_1.5.0 stringi_1.8.4
[100] lazyeval_0.2.2 yaml_2.3.10 evaluate_1.0.3
[103] codetools_0.2-20 BiocManager_1.30.25 cli_3.6.3
[106] uwot_0.2.2 xtable_1.8-4 reticulate_1.40.0
[109] munsell_0.5.1 processx_3.8.5 jquerylib_0.1.4
[112] Rcpp_1.0.14 globals_0.16.3 spatstat.random_3.3-2
[115] png_0.1-8 spatstat.univar_3.1-1 parallel_4.4.0
[118] dotCall64_1.2 listenv_0.9.1 viridisLite_0.4.2
[121] scales_1.3.0 ggridges_0.5.6 crayon_1.5.3
[124] rlang_1.1.5 cowplot_1.1.3