16 Cell cycle Assignment
In some datasets, the phase of cell cycle that a cell is in (G1/G2M/S) can account for a lot of the observed transcriptomic variation. There may be clustering by phase, or separation in the UMAP by phase.
Seurat provides a simple method for assigning cell cycle state to each cell. Other methods are available.
More information about assigning cell cycle states to cells is in the cell cycle vignette
# A list of cell cycle markers, from Tirosh et al, 2015, is loaded with Seurat.  We can
# segregate this list into markers of G2/M phase and markers of S phase
s.genes   <- cc.genes$s.genes
g2m.genes <- cc.genes$g2m.genes

# Use those lists with the cell cycle scoring function in Seurat.
seurat_object <- CellCycleScoring(seurat_object, s.features = s.genes, g2m.features = g2m.genes)
#> Warning: The following features are not present in the
#> object: TYMS, MCM2, MCM4, UNG, GINS2, CDCA7, DTL, UHRF1,
#> MLF1IP, HELLS, RAD51AP1, GMNN, WDR76, CCNE2, ATAD2, RAD51,
#> RRM2, CDC45, CDC6, EXO1, DSCC1, BLM, CASP8AP2, CLSPN,
#> POLA1, CHAF1B, BRIP1, E2F8, not searching for symbol
#> synonyms
#> Warning: The following features are not present in the
#> object: CDK1, NUSAP1, UBE2C, BIRC5, TPX2, TOP2A, NDC80,
#> NUF2, MKI67, FAM64A, CCNB2, CKAP2L, AURKB, BUB1, KIF11,
#> GTSE1, HJURP, CDCA3, CDC20, TTK, CDC25C, KIF2C, NCAPD2,
#> DLGAP5, CDCA2, CDCA8, ECT2, KIF23, HMMR, AURKA, PSRC1,
#> ANLN, CENPE, NEK2, GAS2L3, CENPA, not searching for symbol
#> synonyms
Which adds S.Score, G2M.Score and Phase calls to the metadata.
head(seurat_object@meta.data)
#>                     orig.ident nCount_RNA nFeature_RNA  ind
#> AGGGCGCTATTTCC-1 SeuratProject       2053          532 1256
#> GGAGACGATTCGTT-1 SeuratProject        881          392 1256
#> CACCGTTGTCGTAG-1 SeuratProject       3130         1005 1016
#> TATCGTACACGCAT-1 SeuratProject       1042          549 1488
#> TACGAGACCTATTC-1 SeuratProject       2425          777 1244
#> GTACTACTCATACG-1 SeuratProject       3951         1064 1256
#>                  stim              cell multiplets
#> AGGGCGCTATTTCC-1 stim   CD14+ Monocytes    singlet
#> GGAGACGATTCGTT-1 stim       CD4 T cells    singlet
#> CACCGTTGTCGTAG-1 ctrl FCGR3A+ Monocytes    singlet
#> TATCGTACACGCAT-1 stim           B cells    singlet
#> TACGAGACCTATTC-1 stim       CD4 T cells    singlet
#> GTACTACTCATACG-1 ctrl FCGR3A+ Monocytes    singlet
#>                  percent.mt RNA_snn_res.0.6 seurat_clusters
#> AGGGCGCTATTTCC-1  1.6336634               1               3
#> GGAGACGATTCGTT-1  4.8809524               5              17
#> CACCGTTGTCGTAG-1  1.0655473               4              12
#> TATCGTACACGCAT-1  3.0662710               3              13
#> TACGAGACCTATTC-1  1.0837849               0               9
#> GTACTACTCATACG-1  0.7137395               4              12
#>                  pca_clusters harmony_clusters
#> AGGGCGCTATTTCC-1            3                1
#> GGAGACGATTCGTT-1            0                5
#> CACCGTTGTCGTAG-1            9                4
#> TATCGTACACGCAT-1            6                3
#> TACGAGACCTATTC-1            0                0
#> GTACTACTCATACG-1            9                4
#>                  RNA_snn_res.0.4 RNA_snn_res.0.8
#> AGGGCGCTATTTCC-1               1               0
#> GGAGACGATTCGTT-1               5               8
#> CACCGTTGTCGTAG-1               4               7
#> TATCGTACACGCAT-1               3               3
#> TACGAGACCTATTC-1               0               1
#> GTACTACTCATACG-1               4               7
#>                  RNA_snn_res.1 RNA_snn_res.1.2
#> AGGGCGCTATTTCC-1             0               0
#> GGAGACGATTCGTT-1             8               8
#> CACCGTTGTCGTAG-1             7               7
#> TATCGTACACGCAT-1             3               4
#> TACGAGACCTATTC-1             1               1
#> GTACTACTCATACG-1             7               7
#>                  RNA_snn_res.1.4 RNA_snn_res.1.6
#> AGGGCGCTATTTCC-1               0               0
#> GGAGACGATTCGTT-1              10              14
#> CACCGTTGTCGTAG-1               9              11
#> TATCGTACACGCAT-1               3               1
#> TACGAGACCTATTC-1               8               9
#> GTACTACTCATACG-1               9              11
#>                  RNA_snn_res.1.8 RNA_snn_res.2     markers
#> AGGGCGCTATTTCC-1               0             3          c1
#> GGAGACGATTCGTT-1              14            17          c5
#> CACCGTTGTCGTAG-1              11            12          c4
#> TATCGTACACGCAT-1               1            13     B cells
#> TACGAGACCTATTC-1               8             9 CD4 T cells
#> GTACTACTCATACG-1              11            12          c4
#>                  CD8 T cells1  NK cells1 SingleR.labels
#> AGGGCGCTATTTCC-1   -0.1770011 -0.3540023       Monocyte
#> GGAGACGATTCGTT-1    0.0000000 -0.8528620        T_cells
#> CACCGTTGTCGTAG-1    0.0000000 -0.8614469       Monocyte
#> TATCGTACACGCAT-1    0.0000000 -1.1436483    Neutrophils
#> TACGAGACCTATTC-1    0.0000000 -1.0049660        T_cells
#> GTACTACTCATACG-1   -0.2523165 -0.7395333       Monocyte
#>                  sample_name       sample_celltype_name
#> AGGGCGCTATTTCC-1   stim.1256   CD14+Monocytes.1256.stim
#> GGAGACGATTCGTT-1   stim.1256        CD4Tcells.1256.stim
#> CACCGTTGTCGTAG-1   ctrl.1016 FCGR3A+Monocytes.1016.ctrl
#> TATCGTACACGCAT-1   stim.1488           Bcells.1488.stim
#> TACGAGACCTATTC-1   stim.1244        CD4Tcells.1244.stim
#> GTACTACTCATACG-1   ctrl.1256 FCGR3A+Monocytes.1256.ctrl
#>                      S.Score   G2M.Score Phase
#> AGGGCGCTATTTCC-1 -0.06808986 -0.08878508    G1
#> GGAGACGATTCGTT-1  0.09975063 -0.06812238     S
#> CACCGTTGTCGTAG-1 -0.12770457  0.16052598   G2M
#> TATCGTACACGCAT-1  0.08685571 -0.08316351     S
#> TACGAGACCTATTC-1 -0.02572695  0.02074759   G2M
#> GTACTACTCATACG-1 -0.07294007 -0.01517046    G1
We can then check the cell phase on the UMAP. In this dataset, phase isn’t driving the clustering, and would not require any further handling.
DimPlot(seurat_object, reduction = 'umap_harmony', group.by = "Phase")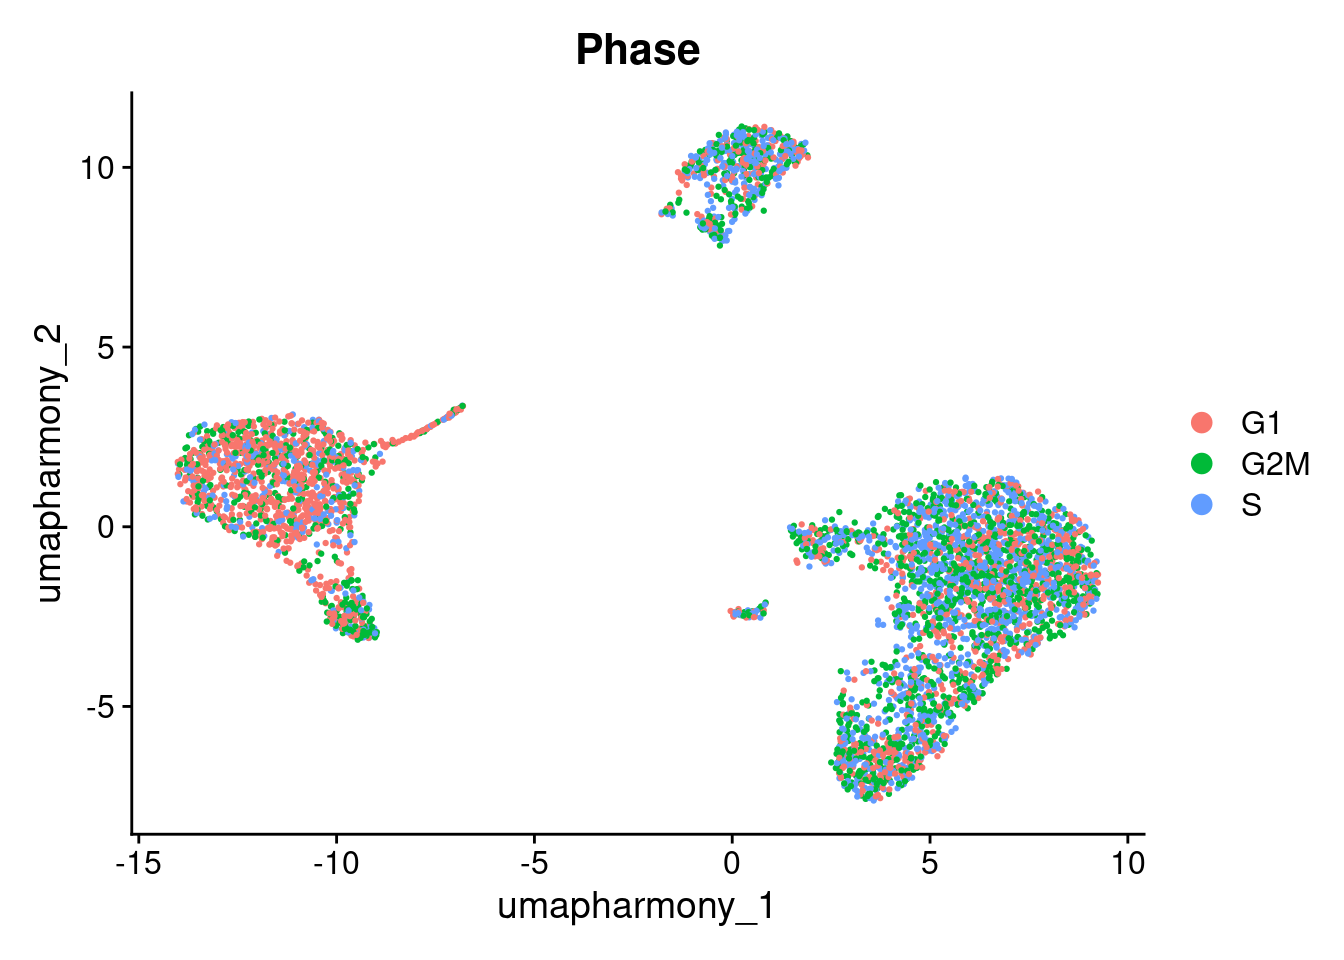
Where a bias is present, your course of action depends on the task at hand. It might involve ‘regressing out’ the cell cycle variation when scaling data ScaleData(kang, vars.to.regress="Phase"), omitting cell-cycle dominated clusters, or just accounting for it in your differential expression calculations.
If you are working with non-human data, you will need to convert these gene lists, or find new cell cycle associated genes in your species.