8 Cell cycle Assignment
In some datasets, the phase of cell cycle that a cell is in (G1/G2M/S) can account for alot of the observed transcriptomic variation. There may be clustering by phase, or separation in the UMAP by phase.
Seurat provides a simple method for assigning cell cycle state to each cell. Other methods are available.
More information about assigning cell cycle states to cells is in the cell cycle vignette
# A list of cell cycle markers, from Tirosh et al, 2015, is loaded with Seurat.  We can
# segregate this list into markers of G2/M phase and markers of S phase
s.genes   <- cc.genes$s.genes
g2m.genes <- cc.genes$g2m.genes

# Use those lists with the cell cycle scoring function in Seurat.
pbmc <- CellCycleScoring(pbmc, s.features = s.genes, g2m.features = g2m.genes)
#> Warning: The following features are not present in the
#> object: DTL, UHRF1, MLF1IP, EXO1, CASP8AP2, BRIP1, E2F8,
#> not searching for symbol synonyms
#> Warning: The following features are not present in the
#> object: FAM64A, BUB1, HJURP, CDCA3, TTK, CDC25C, DLGAP5,
#> CDCA2, ANLN, GAS2L3, not searching for symbol synonyms
Which adds S.Score, G2M.Score and Phase calls to the metadata.
head(pbmc@meta.data)
#>                  orig.ident nCount_RNA nFeature_RNA
#> AAACATACAACCAC-1     pbmc3k       2419          779
#> AAACATTGAGCTAC-1     pbmc3k       4903         1352
#> AAACATTGATCAGC-1     pbmc3k       3147         1129
#> AAACCGTGCTTCCG-1     pbmc3k       2639          960
#> AAACCGTGTATGCG-1     pbmc3k        980          521
#> AAACGCACTGGTAC-1     pbmc3k       2163          781
#>                  percent.mt RNA_snn_res.0.5 seurat_clusters
#> AAACATACAACCAC-1  3.0177759               2               6
#> AAACATTGAGCTAC-1  3.7935958               3               1
#> AAACATTGATCAGC-1  0.8897363               2               0
#> AAACCGTGCTTCCG-1  1.7430845               1               5
#> AAACCGTGTATGCG-1  1.2244898               6               8
#> AAACGCACTGGTAC-1  1.6643551               2               0
#>                  RNA_snn_res.0.1 RNA_snn_res.0.2
#> AAACATACAACCAC-1               0               0
#> AAACATTGAGCTAC-1               3               3
#> AAACATTGATCAGC-1               0               0
#> AAACCGTGCTTCCG-1               1               1
#> AAACCGTGTATGCG-1               2               2
#> AAACGCACTGGTAC-1               0               0
#>                  RNA_snn_res.0.3 RNA_snn_res.0.4
#> AAACATACAACCAC-1               0               2
#> AAACATTGAGCTAC-1               3               3
#> AAACATTGATCAGC-1               0               2
#> AAACCGTGCTTCCG-1               1               1
#> AAACCGTGTATGCG-1               2               6
#> AAACGCACTGGTAC-1               0               2
#>                  RNA_snn_res.0.6 RNA_snn_res.0.7
#> AAACATACAACCAC-1               1               1
#> AAACATTGAGCTAC-1               3               3
#> AAACATTGATCAGC-1               1               1
#> AAACCGTGCTTCCG-1               2               2
#> AAACCGTGTATGCG-1               6               6
#> AAACGCACTGGTAC-1               1               1
#>                  RNA_snn_res.0.8 RNA_snn_res.0.9
#> AAACATACAACCAC-1               6               1
#> AAACATTGAGCTAC-1               2               2
#> AAACATTGATCAGC-1               1               1
#> AAACCGTGCTTCCG-1               4               4
#> AAACCGTGTATGCG-1               8               7
#> AAACGCACTGGTAC-1               1               1
#>                  RNA_snn_res.1 RNA_snn_res.1.1
#> AAACATACAACCAC-1             6               6
#> AAACATTGAGCTAC-1             2               2
#> AAACATTGATCAGC-1             1               1
#> AAACCGTGCTTCCG-1             4               4
#> AAACCGTGTATGCG-1             8               8
#> AAACGCACTGGTAC-1             1               1
#>                  RNA_snn_res.1.2 RNA_snn_res.1.3
#> AAACATACAACCAC-1               6               8
#> AAACATTGAGCTAC-1               2               2
#> AAACATTGATCAGC-1               1               0
#> AAACCGTGCTTCCG-1               4               5
#> AAACCGTGTATGCG-1               8               9
#> AAACGCACTGGTAC-1               1               0
#>                  RNA_snn_res.1.4 RNA_snn_res.1.5
#> AAACATACAACCAC-1               8               9
#> AAACATTGAGCTAC-1               2               2
#> AAACATTGATCAGC-1               0               1
#> AAACCGTGCTTCCG-1               5               4
#> AAACCGTGTATGCG-1               9               8
#> AAACGCACTGGTAC-1               0               1
#>                  RNA_snn_res.1.6 RNA_snn_res.1.7
#> AAACATACAACCAC-1               8               8
#> AAACATTGAGCTAC-1               1               1
#> AAACATTGATCAGC-1               0               0
#> AAACCGTGCTTCCG-1               3               3
#> AAACCGTGTATGCG-1               7               7
#> AAACGCACTGGTAC-1               0               0
#>                  RNA_snn_res.1.8 RNA_snn_res.1.9
#> AAACATACAACCAC-1               7               6
#> AAACATTGAGCTAC-1               1               1
#> AAACATTGATCAGC-1               0               0
#> AAACCGTGCTTCCG-1               3               3
#> AAACCGTGTATGCG-1               8               8
#> AAACGCACTGGTAC-1               0               0
#>                  RNA_snn_res.2 Naive_CD4_T1  cell_label
#> AAACATACAACCAC-1             6   1.22824523 Naive_CD4_T
#> AAACATTGAGCTAC-1             1  -0.08111043        <NA>
#> AAACATTGATCAGC-1             0  -0.37682601        <NA>
#> AAACCGTGCTTCCG-1             5  -0.72739714        <NA>
#> AAACCGTGTATGCG-1             8  -1.17396454        <NA>
#> AAACGCACTGGTAC-1             0  -0.63807586        <NA>
#>                  cluster    celltype pretty_cluster_labels
#> AAACATACAACCAC-1      c2 Memory CD4+       c2: Memory CD4+
#> AAACATTGAGCTAC-1      c3           B                 c3: B
#> AAACATTGATCAGC-1      c2 Memory CD4+       c2: Memory CD4+
#> AAACCGTGCTTCCG-1      c1  CD14+ Mono        c1: CD14+ Mono
#> AAACCGTGTATGCG-1      c6          NK                c6: NK
#> AAACGCACTGGTAC-1      c2 Memory CD4+       c2: Memory CD4+
#>                  SingleR.labels     S.Score    G2M.Score
#> AAACATACAACCAC-1        T_cells  0.09853841 -0.044716507
#> AAACATTGAGCTAC-1         B_cell -0.02364305 -0.046889929
#> AAACATTGATCAGC-1        T_cells -0.02177266  0.074841537
#> AAACCGTGCTTCCG-1       Monocyte  0.03794398  0.006575446
#> AAACCGTGTATGCG-1        NK_cell -0.03309970  0.027910063
#> AAACGCACTGGTAC-1        T_cells -0.04814181 -0.078164839
#>                  Phase
#> AAACATACAACCAC-1     S
#> AAACATTGAGCTAC-1    G1
#> AAACATTGATCAGC-1   G2M
#> AAACCGTGCTTCCG-1     S
#> AAACCGTGTATGCG-1   G2M
#> AAACGCACTGGTAC-1    G1
We can then check the cell phase on the UMAP. In this dataset, phase isn’t driving the clustering, and would not require any further handling.
DimPlot(pbmc, reduction = 'umap', group.by = "Phase")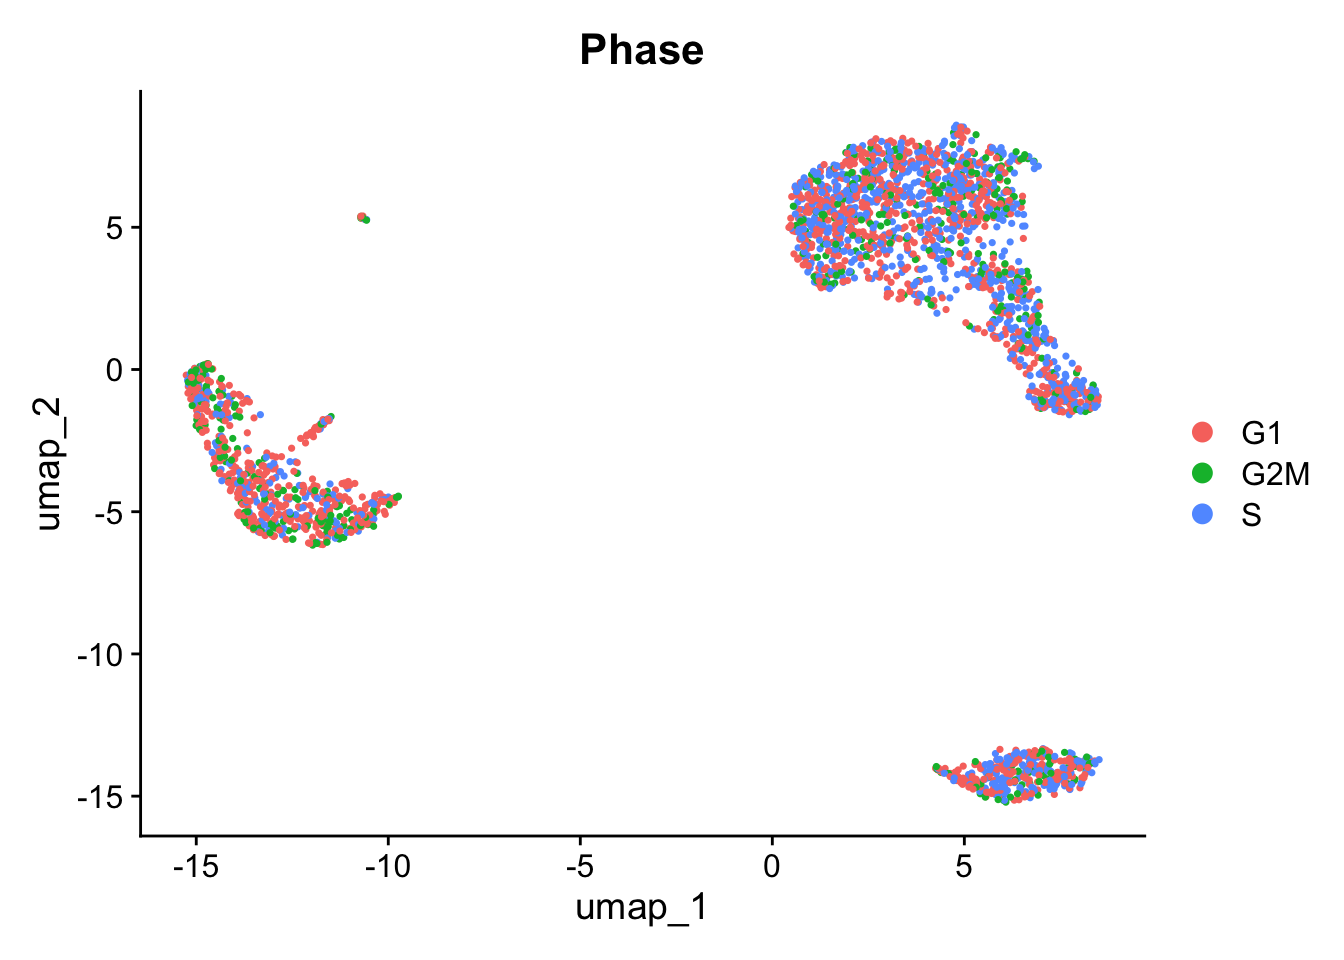
Where a bias is present, your course of action depends on the task at hand. It might involve ‘regressing out’ the cell cycle variation when scaling data ScaleData(kang, vars.to.regress="Phase"), omitting cell-cycle dominated clusters, or just accounting for it in your differential expression calculations.
If you are working with non-human data, you will need to convert these gene lists, or find new cell cycle associated genes in your species.