9 Data set integration with Harmony
Why do we need to do this?
You can have data coming from different samples, batches or experiments and you will need to combine them.
When data is collected from multiple samples, multiple runs of the single cell sequencing library preparation, or multiple conditions, cells of the same type may become separated in the UMAP and be put into several different clusters.
For the purpose of clustering and cell identification, we would like to remove such effects.
We will now look at GSE96583, another PBMC dataset. For speed, we will be looking at a subset of 5000 cells from this data. The cells in this dataset were pooled from eight individual donors. A nice feature is that genetic differences allow some of the cell doublets to be identified. This data contains two batches of single cell sequencing. One of the batches was stimulated with IFN-beta.
The data has already been processed as we have done with the first PBMC dataset, and can be loaded from kang2018.rds.
kang <- readRDS("data/kang2018.rds")

head(kang@meta.data)
#>                     orig.ident nCount_RNA nFeature_RNA  ind
#> AGGGCGCTATTTCC-1 SeuratProject       2020          523 1256
#> GGAGACGATTCGTT-1 SeuratProject        840          381 1256
#> CACCGTTGTCGTAG-1 SeuratProject       3097          995 1016
#> TATCGTACACGCAT-1 SeuratProject       1011          540 1488
#> TGACGCCTTGCTTT-1 SeuratProject        570          367  101
#> TACGAGACCTATTC-1 SeuratProject       2399          770 1244
#>                  stim              cell multiplets
#> AGGGCGCTATTTCC-1 stim   CD14+ Monocytes    singlet
#> GGAGACGATTCGTT-1 stim       CD4 T cells    singlet
#> CACCGTTGTCGTAG-1 ctrl FCGR3A+ Monocytes    singlet
#> TATCGTACACGCAT-1 stim           B cells    singlet
#> TGACGCCTTGCTTT-1 ctrl       CD4 T cells       ambs
#> TACGAGACCTATTC-1 stim CD4 T cells singlet-
indidentifies a cell as coming from one of 8 individuals. -
stimidentifies a cell as control or stimulated with IFN-beta. -
cellcontains the cell types identified by the creators of this data set. -
multipletsclassifies cells as singlet or doublet.
DimPlot(kang, reduction="umap", group.by="ind")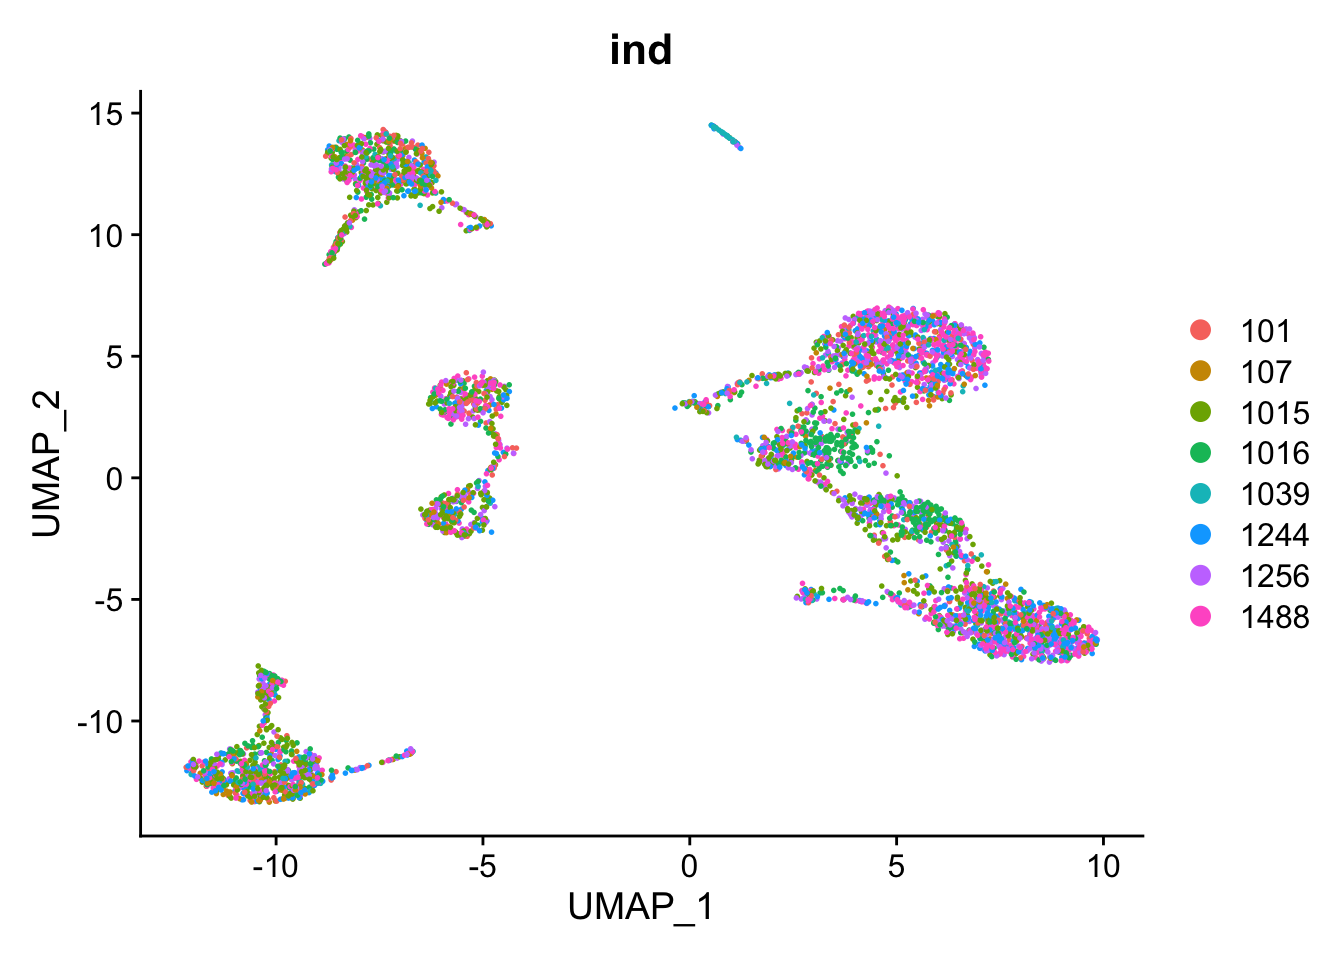
DimPlot(kang, reduction="umap", group.by="stim")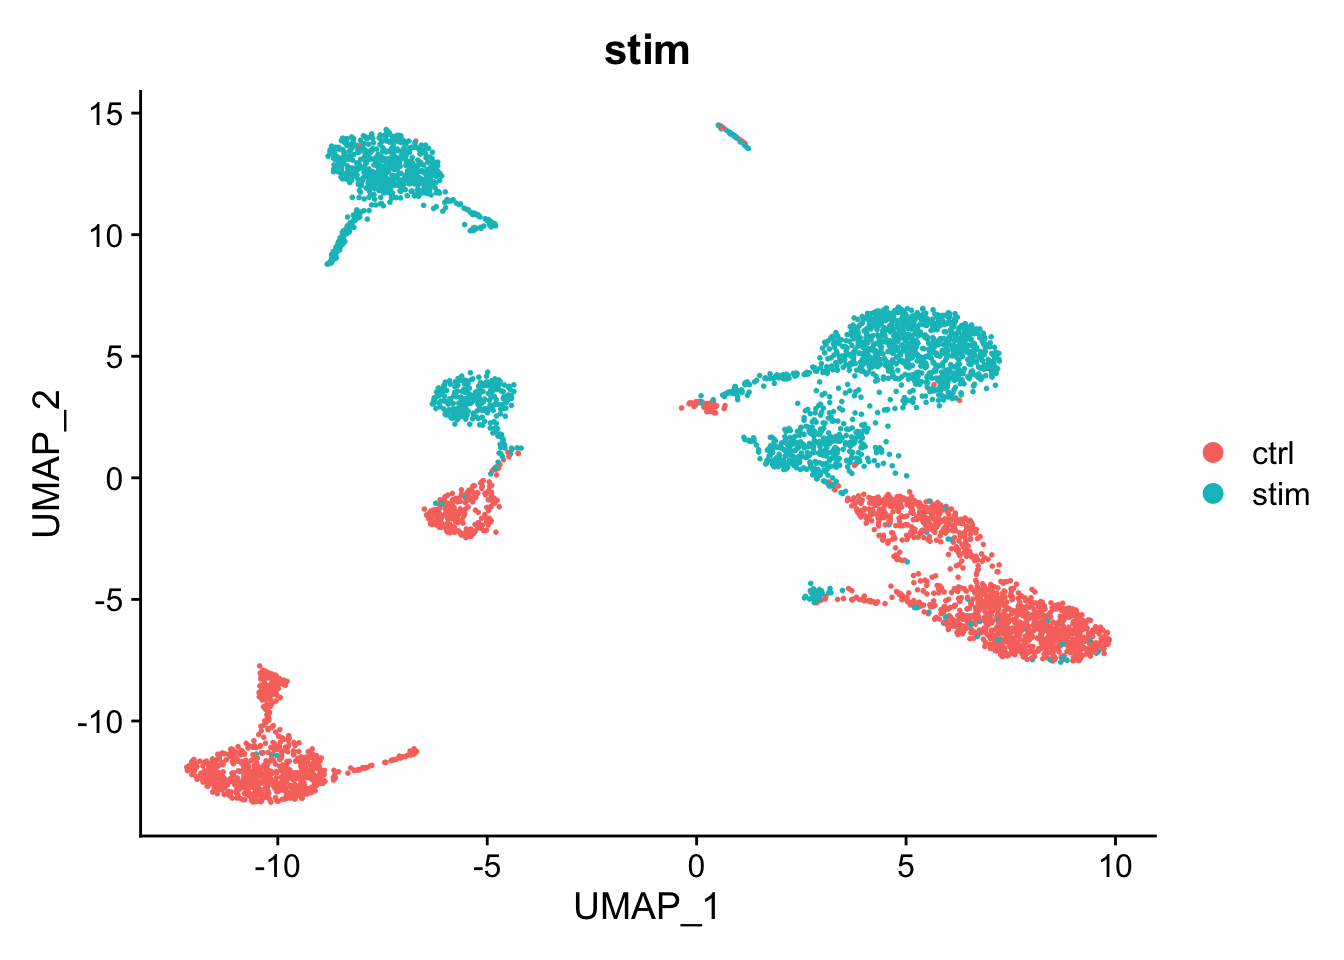
kang <- FindNeighbors(kang, reduction="pca", dims=1:10)
#> Computing nearest neighbor graph
#> Computing SNN
kang <- FindClusters(kang, resolution=0.25)
#> Modularity Optimizer version 1.3.0 by Ludo Waltman and Nees Jan van Eck
#>
#> Number of nodes: 5000
#> Number of edges: 175130
#>
#> Running Louvain algorithm...
#> Maximum modularity in 10 random starts: 0.9501
#> Number of communities: 12
#> Elapsed time: 0 seconds
kang$pca_clusters <- kang$seurat_clusters

DimPlot(kang, reduction="umap", group.by="pca_clusters")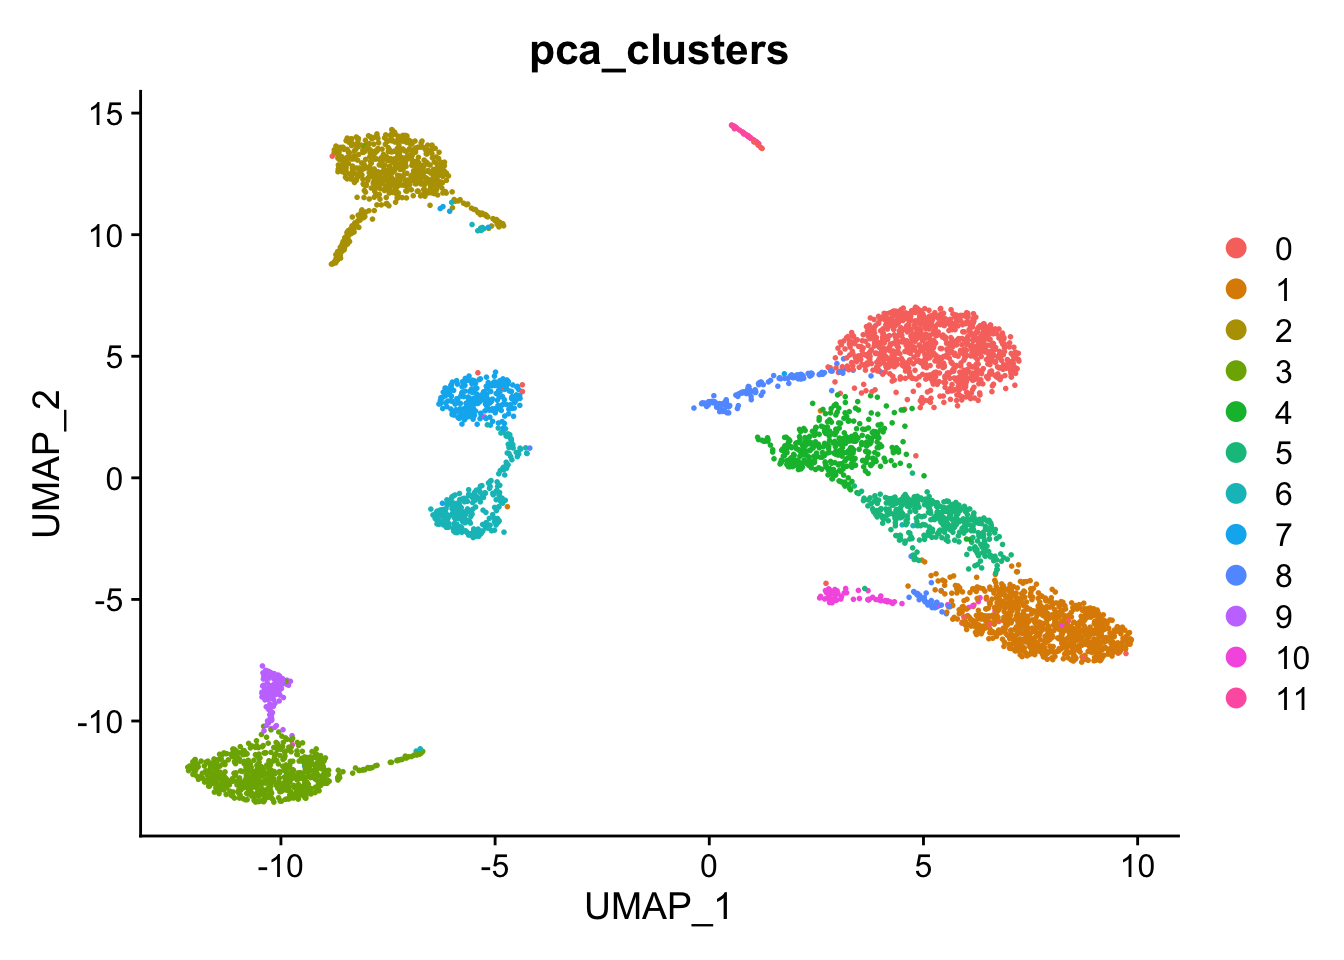
There is a big difference between unstimulated and stimulated cells. This has split cells of the same type into pairs of clusters. If the difference was simply uniform, we could regress it out (e.g. using ScaleData(..., vars.to.regress="stim")). However, as can be seen in the PCA plot, the difference is not uniform and we need to do something cleverer.
We will use Harmony, which can remove non-uniform effects. We will try to remove both the small differences between individuals and the large difference between the unstimulated and stimulated cells.
Harmony operates only on the PCA scores. The original gene expression levels remain unaltered.
library(harmony)
#> Loading required package: Rcpp

kang <- RunHarmony(kang, c("stim", "ind"), reduction.use="pca")
#> Harmony 1/10
#> Harmony 2/10
#> Harmony 3/10
#> Harmony 4/10
#> Harmony 5/10
#> Harmony 6/10
#> Harmony 7/10
#> Harmony 8/10
#> Harmony 9/10
#> Harmony converged after 9 iterations
This has added a new set of reduced dimensions to the Seurat object, kang$harmony which is a modified version of the existing kang$pca reduced dimensions. The PCA plot shows a large difference between ‘ctrl’ and ‘stim’, but this has been removed in the harmony reduction.
DimPlot(kang, reduction="pca", group.by="stim")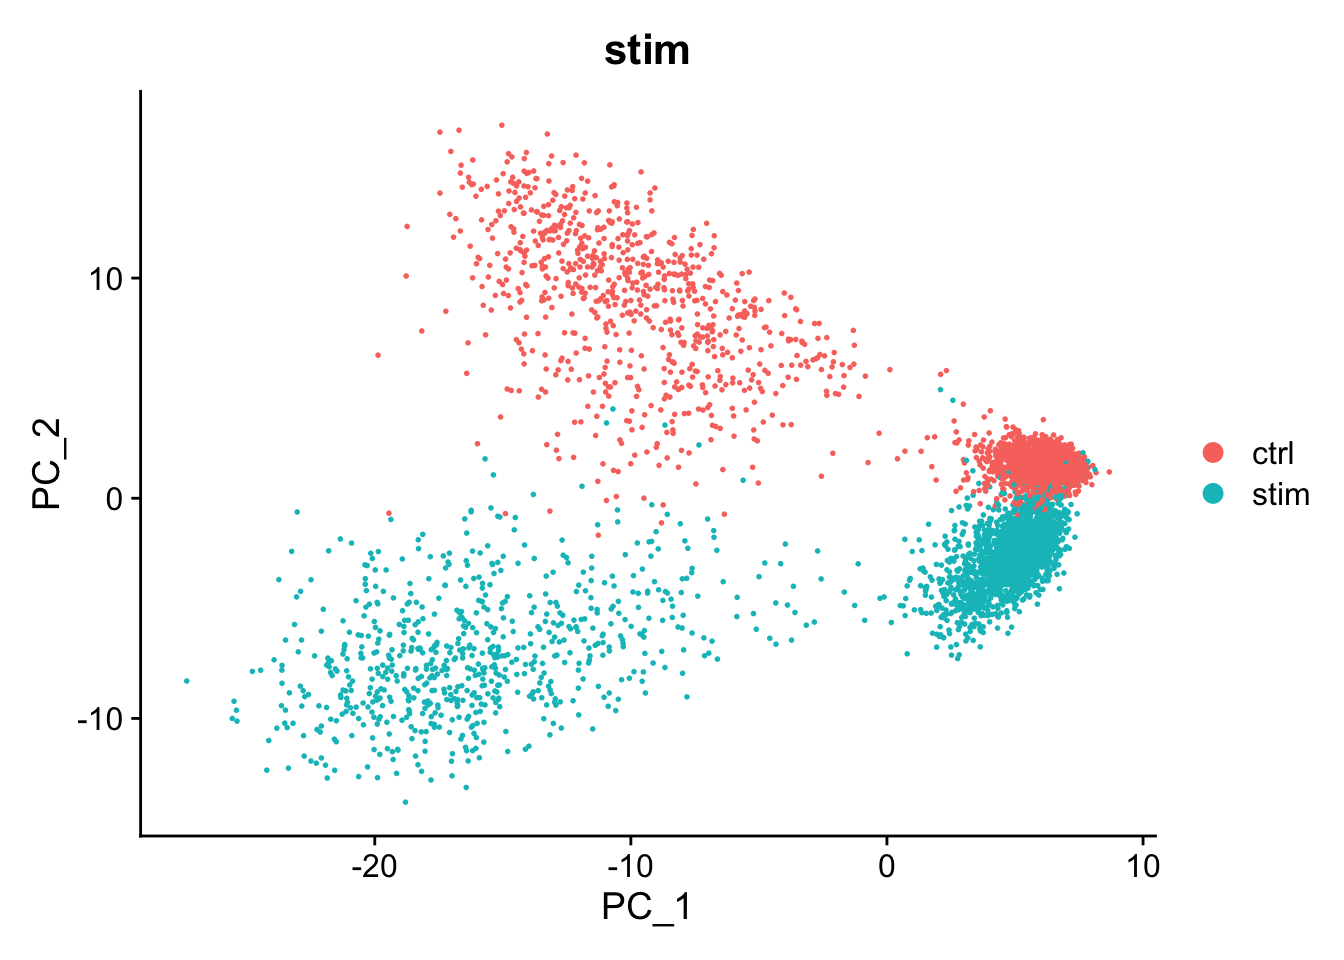
DimPlot(kang, reduction="harmony", group.by="stim")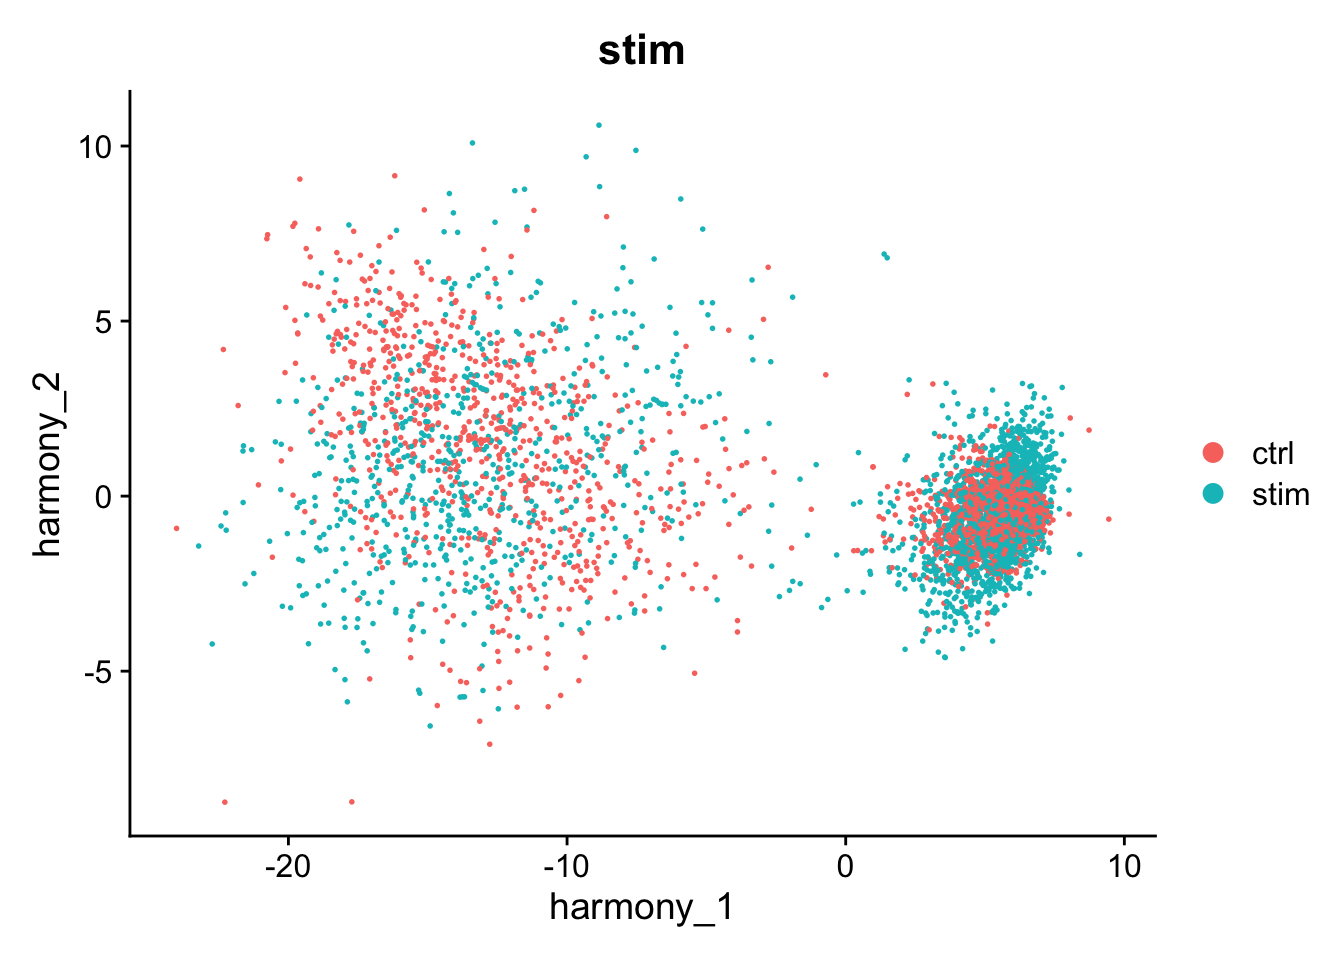
We can use harmony the same way we used the pca reduction to compute a UMAP layout or to find clusters.
kang <- RunUMAP(kang, reduction="harmony", dims=1:10, reduction.name="umap_harmony")
#> 14:28:06 UMAP embedding parameters a = 0.9922 b = 1.112
#> Found more than one class "dist" in cache; using the first, from namespace 'spam'
#> Also defined by 'BiocGenerics'
#> 14:28:06 Read 5000 rows and found 10 numeric columns
#> 14:28:06 Using Annoy for neighbor search, n_neighbors = 30
#> Found more than one class "dist" in cache; using the first, from namespace 'spam'
#> Also defined by 'BiocGenerics'
#> 14:28:06 Building Annoy index with metric = cosine, n_trees = 50
#> 0%   10   20   30   40   50   60   70   80   90   100%
#> [----|----|----|----|----|----|----|----|----|----|
#> **************************************************|
#> 14:28:06 Writing NN index file to temp file /var/folders/tp/b078yqdd4ydff9fx87lfttpj_sc0x3/T//Rtmpa9MTRd/file82e53cc1fa49
#> 14:28:06 Searching Annoy index using 1 thread, search_k = 3000
#> 14:28:07 Annoy recall = 100%
#> 14:28:07 Commencing smooth kNN distance calibration using 1 thread with target n_neighbors = 30
#> 14:28:08 Initializing from normalized Laplacian + noise (using RSpectra)
#> 14:28:08 Commencing optimization for 500 epochs, with 210490 positive edges
#> 14:28:13 Optimization finished

DimPlot(kang, reduction="umap_harmony", group.by="stim")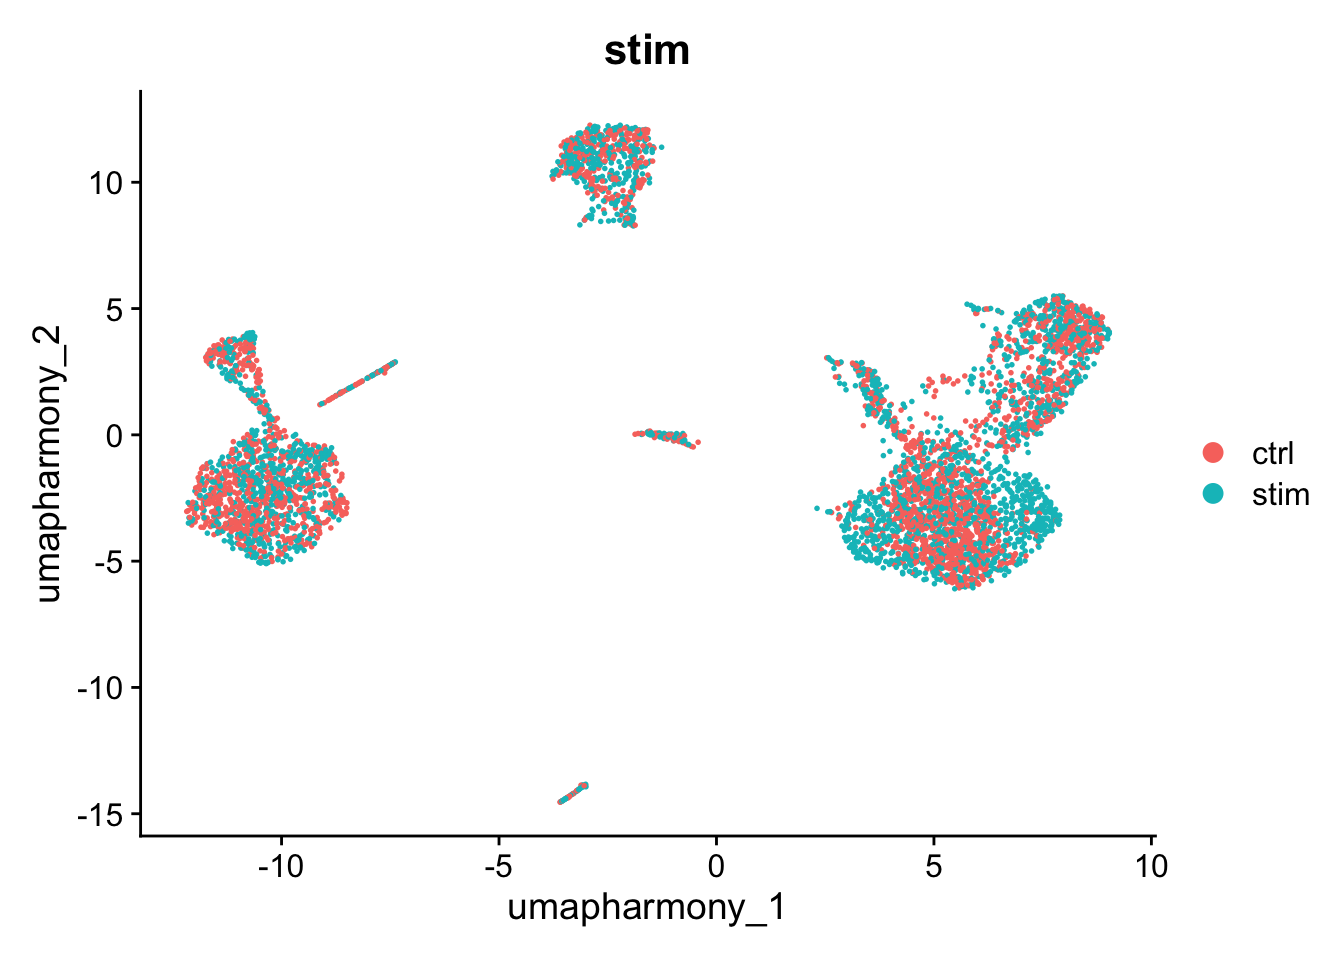
kang <- FindNeighbors(kang, reduction="harmony", dims=1:10)
#> Computing nearest neighbor graph
#> Computing SNN
kang <- FindClusters(kang, resolution=0.25)
#> Modularity Optimizer version 1.3.0 by Ludo Waltman and Nees Jan van Eck
#>
#> Number of nodes: 5000
#> Number of edges: 171396
#>
#> Running Louvain algorithm...
#> Maximum modularity in 10 random starts: 0.9324
#> Number of communities: 9
#> Elapsed time: 0 seconds
kang$harmony_clusters <- kang$seurat_clusters

DimPlot(kang, reduction="umap_harmony", group.by="harmony_clusters")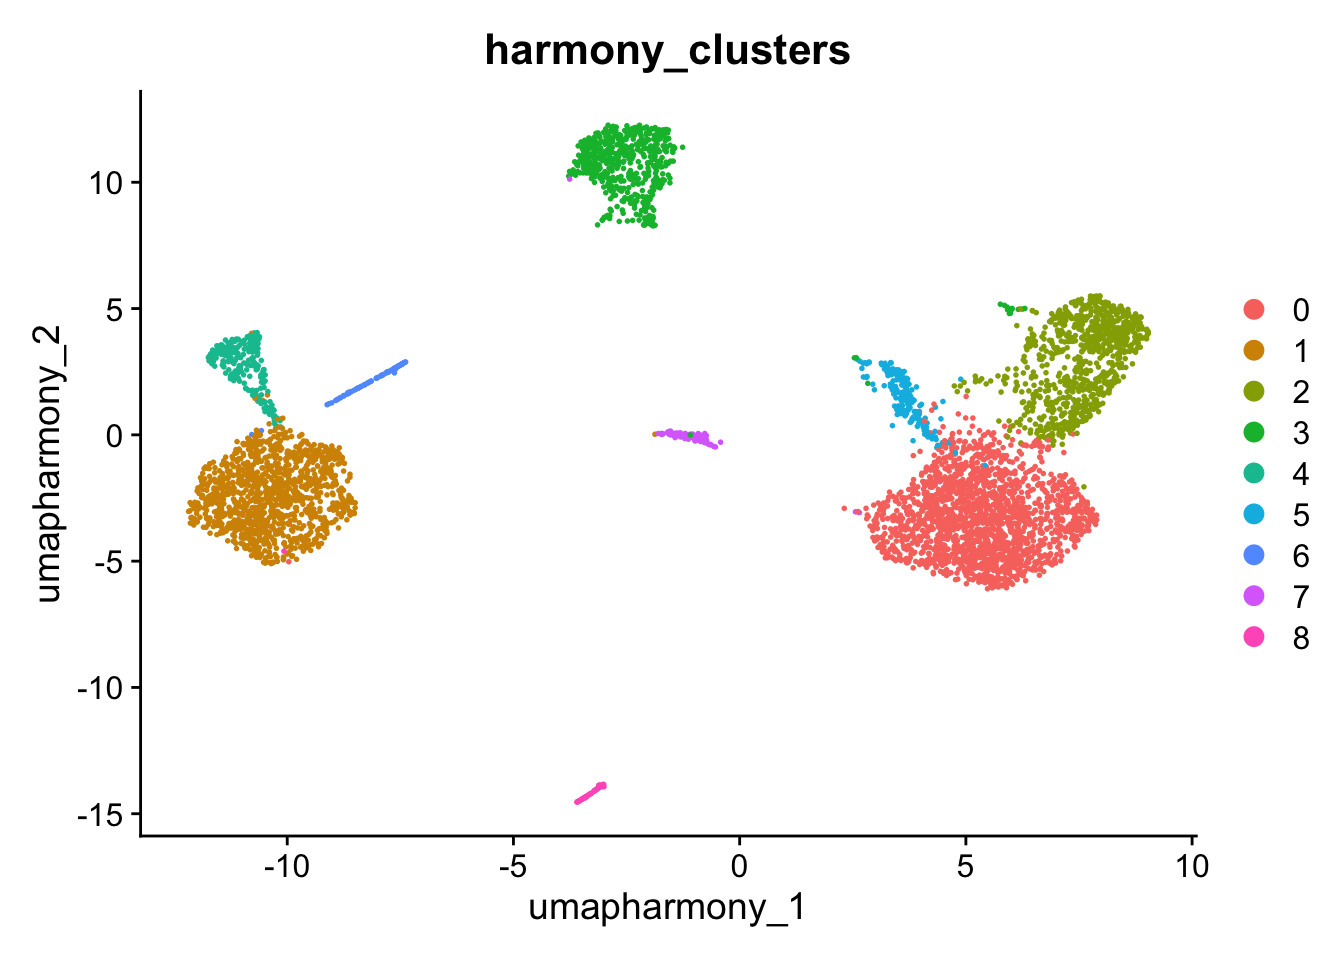
DimPlot(kang, reduction="umap", group.by="harmony_clusters")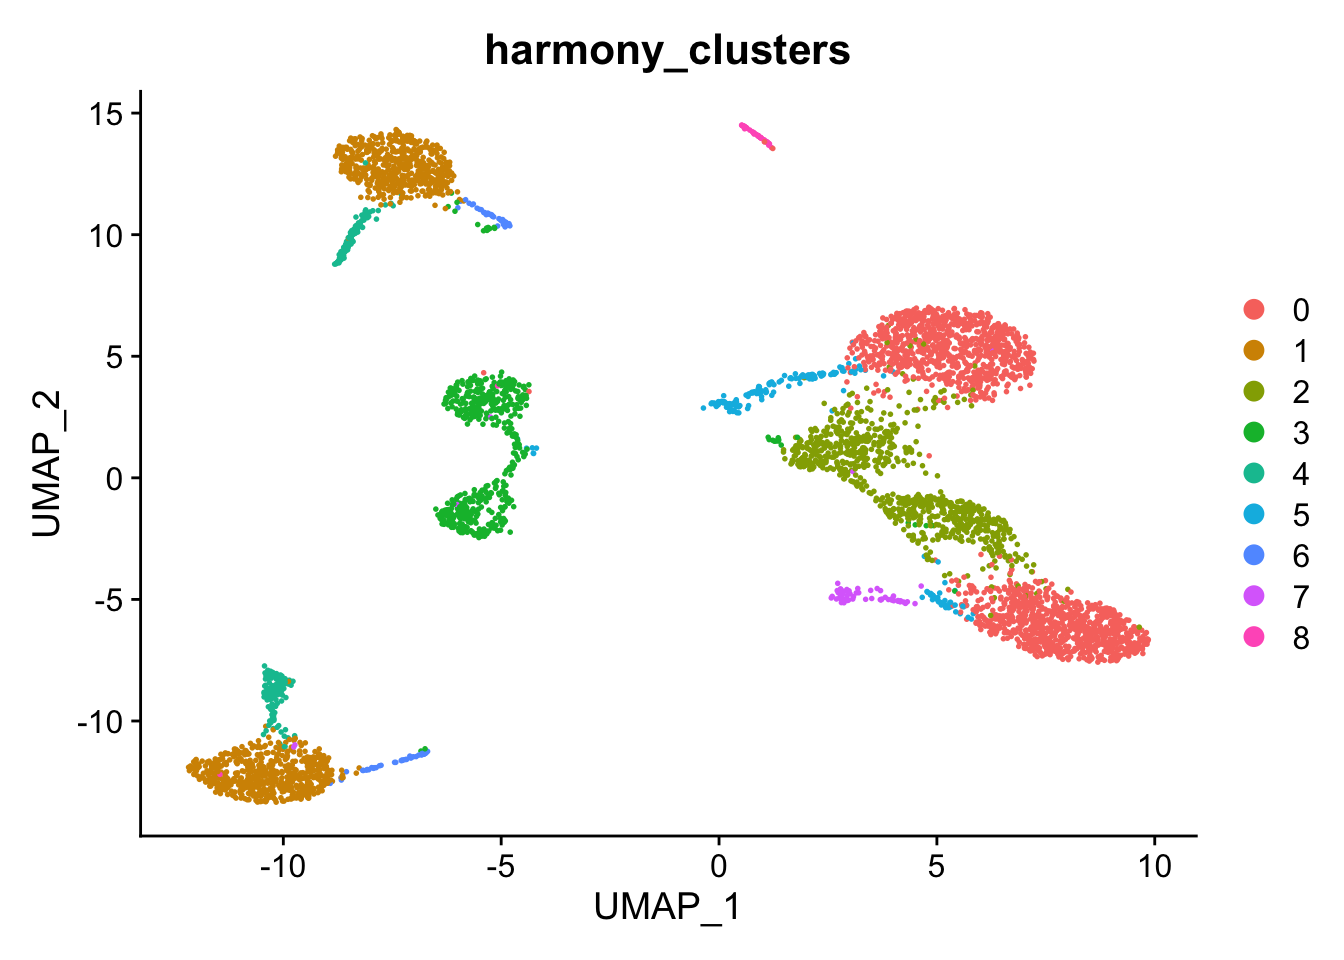
Having found a good set of clusters, we would usually perform differential expression analysis on the original data and include batches/runs/individuals as predictors in the linear model. In this example we could now compare un-stimulated and stimulated cells within each cluster. A particularly nice statistical approach that is possible here would be to convert the counts to pseudo-bulk data for the eight individuals, and then apply a bulk RNA-Seq differential expression analysis method. However there is still the problem that unstimulated and stimulated cells were processed in separate batches.