5 Cluster Markers
Why do we need to do this?
Single cell data helps to segregate cell types. Use markers to identify cell types. warning: In this example the cell types/markers are well known and making this step easy, but in reality this step needs the experts curation.
5.2 Use markers to label or find a cluster
If you know markers for your cell types, use AddModuleScore to label them.
genes_markers <- list(Naive_CD4_T = c("IL7R", "CCR7"))

pbmc <- AddModuleScore(object = pbmc, features = genes_markers, ctrl = 5, name = "Naive_CD4_T",
    search = TRUE)


# notice the name of the cluster has a 1 at the end
names(pbmc@meta.data)
#>  [1] "orig.ident"      "nCount_RNA"      "nFeature_RNA"
#>  [4] "percent.mt"      "RNA_snn_res.0.5" "seurat_clusters"
#>  [7] "RNA_snn_res.0.1" "RNA_snn_res.0.2" "RNA_snn_res.0.3"
#> [10] "RNA_snn_res.0.4" "RNA_snn_res.0.6" "RNA_snn_res.0.7"
#> [13] "RNA_snn_res.0.8" "RNA_snn_res.0.9" "RNA_snn_res.1"
#> [16] "RNA_snn_res.1.1" "RNA_snn_res.1.2" "RNA_snn_res.1.3"
#> [19] "RNA_snn_res.1.4" "RNA_snn_res.1.5" "RNA_snn_res.1.6"
#> [22] "RNA_snn_res.1.7" "RNA_snn_res.1.8" "RNA_snn_res.1.9"
#> [25] "RNA_snn_res.2"   "Naive_CD4_T1"

# label that cell type
pbmc$cell_label = NA
pbmc$cell_label[pbmc$Naive_CD4_T1 > 1] = "Naive_CD4_T"
Idents(pbmc) = pbmc$cell_label

# plot
# Using a custom colour scale
FeaturePlot(pbmc, features = "Naive_CD4_T1", label = TRUE, repel = TRUE, ) + scale_colour_gradientn(colours = c("lightblue","beige","red"))
#> Scale for colour is already present.
#> Adding another scale for colour, which will replace the
#> existing scale.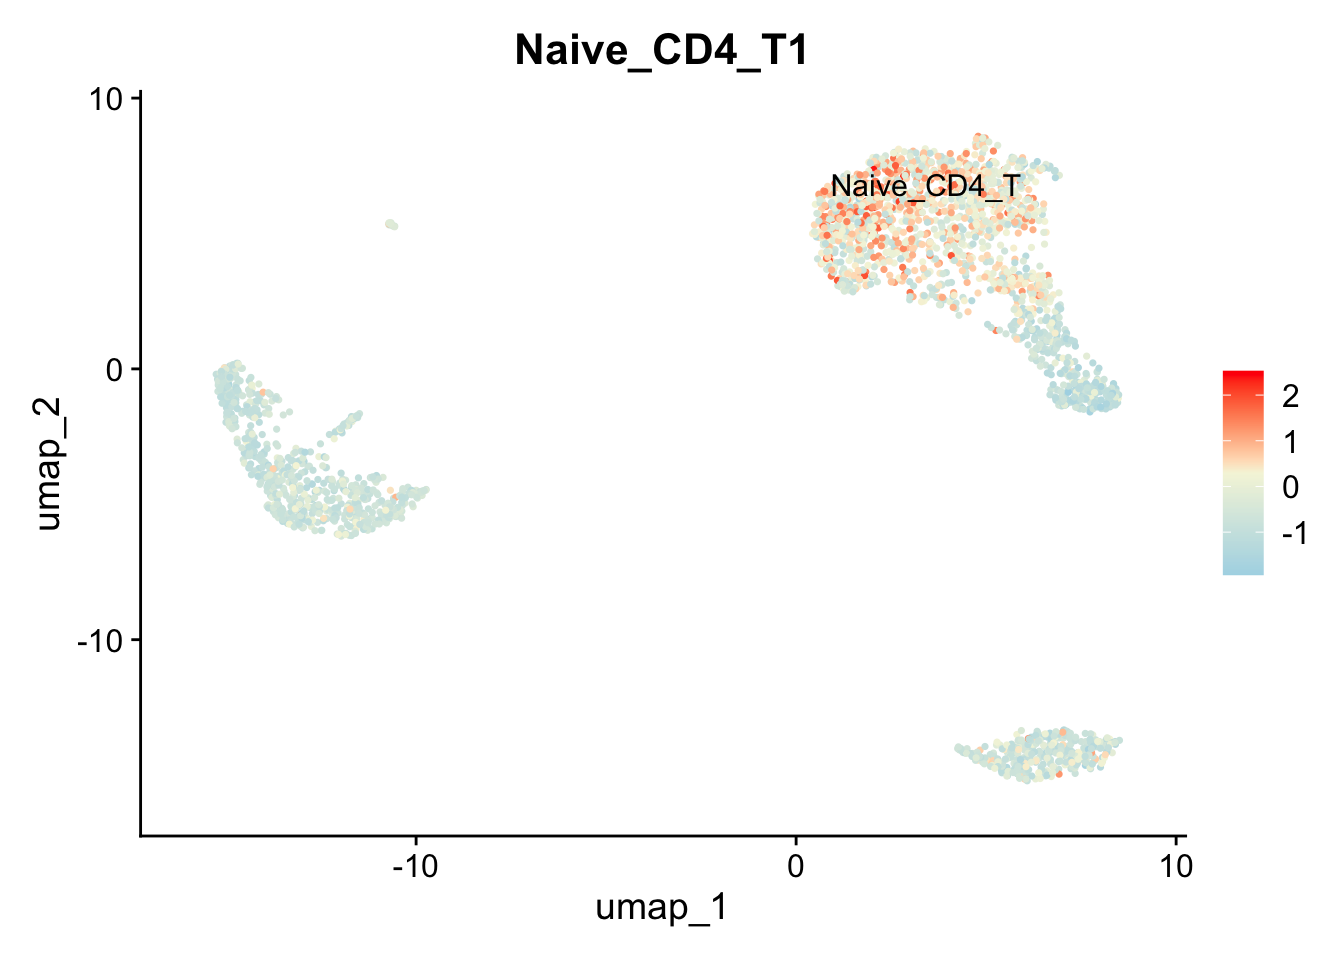
5.3 Assigning cell type identity to clusters
Tutorial: https://satijalab.org/seurat/articles/pbmc3k_tutorial#assigning-cell-type-identity-to-clusters
This is presentend in a very simple way in the tutorial, an expanded approach is below.
First, it can avoid downstream hassles if you add a letter to your clusters so they are no longer just numbers. Here, we prefix a ‘c’ onto the cluster number, and store as a factor.
# Sometimes you need to change Idents, so make sure your favourite cluster is stored in its own column too!
# 5 => c5
pbmc$cluster <- factor( paste0("c", pbmc$RNA_snn_res.0.5),   levels=paste0('c', levels(pbmc$RNA_snn_res.0.5)))
Idents(pbmc) <- pbmc$cluster
levels(pbmc$cluster)
#> [1] "c0" "c1" "c2" "c3" "c4" "c5" "c6" "c7" "c8"
We have clusters c0 to c8.
Now, its time to make a biologically-informed call of what cluster corresponds to what cell type. This step can take time! It often won’t be possible to confidently label all clusters. Some approaches we can use:
- Look at the cluster marker genes.
- Look at known cell type markers - are they restricted to the cluster on the UMAP?
- Use a celltype assignment tool (like singleR) to call celltypes against a reference dataset
- Check the QC metrics on difficult to understand clusters - often cells with low counts will group together. These might be an ‘unknown’/‘poor quality’ cluster.
- Check for weird clusters from just one sample. They might be spurious.
- To separate similar clusters, you can subset your data and calculate cell markers within the subset.
# Template
cluster_content <- list(
  c0 = "",
  c1 = "",
  c2 = "",
  c3 = "",
  c4 = "",
  c5 = "",
  c6 = "",
  c7 = "",
  c8 = ""
)
Finally, when you’ve some up with some labels - you can run store them in your object.
cluster_content <- list(
  c0 = "Naive CD4+ T",
  c1 = "CD14+ Mono",
  c2 = "Memory CD4+",
  c3 = "B",
  c4 = "CD8+ T",
  c5 = "Mono",
  c6 = "NK",
  c7 = "DC",
  c8 = "Platelet"
)

# "c5" => "Mono"
pbmc$celltype <- as.character(cluster_content[pbmc$cluster])
With a little extra code, we can keep the order of our celltypes, and create labels that incorporate the cluster number. It can be useful to keep cluster labels during your analysis (‘CD4+ T’ makes for terrible filenames!), especially where you have multiple clusters with the same celltype (e.g. multiple similar yet different ‘stroma’ celltypes are common).
# "c5" => "Mono"
pbmc$celltype <-factor(as.character(cluster_content[pbmc$cluster]), levels=cluster_content)

# c5 => c5: Mono
pbmc$pretty_cluster_labels <- factor (
  paste0(names(cluster_content[pbmc$cluster]), ": ", cluster_content[pbmc$cluster]) ,
  levels = paste0( names(cluster_content), ": ", cluster_content)
)
What’s in our sample?
pbmc@meta.data %>%
  group_by(RNA_snn_res.0.5, cluster, celltype, pretty_cluster_labels) %>%
  summarise(num_cells=n(), .groups="drop")  %>%
  DT::datatable()
Can we figure out cell types automatically? Yes! There are methods like singleR but they are not perfect.