4 Clustering
Tutorial: https://satijalab.org/seurat/articles/pbmc3k_tutorial#cluster-the-cells
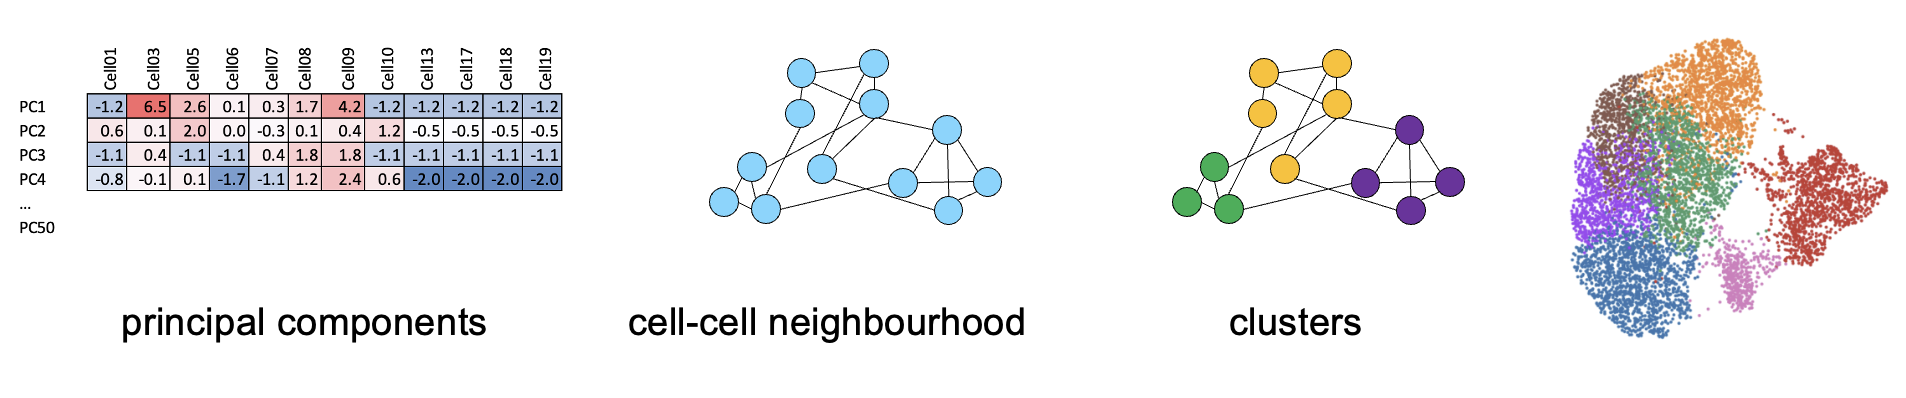
Clustering the cells will allow you to visualise the variability of your data, can help to segregate cells into cell types.
Creating cell clusters the is easy, but understanding what is in them biologically-speaking can take time. We will try some things that aren’t in the introductory seruat tutorial.
4.2 Choosing a cluster resolution
Its a good idea to try different resolutions when clustering to identify the variability of your data.
# Do clustering at 0.1, 0.2, 0.3... 2.0
pbmc <- FindClusters(object = pbmc, reduction = "umap", resolution = seq(0.1, 2, 0.1), dims = 1:10)
#> Warning: The following arguments are not used: reduction,
#> dims

#> Warning: The following arguments are not used: reduction,
#> dims
#> Modularity Optimizer version 1.3.0 by Ludo Waltman and Nees Jan van Eck
#>
#> Number of nodes: 2638
#> Number of edges: 95927
#>
#> Running Louvain algorithm...
#> Maximum modularity in 10 random starts: 0.9623
#> Number of communities: 4
#> Elapsed time: 0 seconds
#> Modularity Optimizer version 1.3.0 by Ludo Waltman and Nees Jan van Eck
#>
#> Number of nodes: 2638
#> Number of edges: 95927
#>
#> Running Louvain algorithm...
#> Maximum modularity in 10 random starts: 0.9346
#> Number of communities: 7
#> Elapsed time: 0 seconds
#> Modularity Optimizer version 1.3.0 by Ludo Waltman and Nees Jan van Eck
#>
#> Number of nodes: 2638
#> Number of edges: 95927
#>
#> Running Louvain algorithm...
#> Maximum modularity in 10 random starts: 0.9091
#> Number of communities: 7
#> Elapsed time: 0 seconds
#> Modularity Optimizer version 1.3.0 by Ludo Waltman and Nees Jan van Eck
#>
#> Number of nodes: 2638
#> Number of edges: 95927
#>
#> Running Louvain algorithm...
#> Maximum modularity in 10 random starts: 0.8890
#> Number of communities: 9
#> Elapsed time: 0 seconds
#> Modularity Optimizer version 1.3.0 by Ludo Waltman and Nees Jan van Eck
#>
#> Number of nodes: 2638
#> Number of edges: 95927
#>
#> Running Louvain algorithm...
#> Maximum modularity in 10 random starts: 0.8728
#> Number of communities: 9
#> Elapsed time: 0 seconds
#> Modularity Optimizer version 1.3.0 by Ludo Waltman and Nees Jan van Eck
#>
#> Number of nodes: 2638
#> Number of edges: 95927
#>
#> Running Louvain algorithm...
#> Maximum modularity in 10 random starts: 0.8564
#> Number of communities: 10
#> Elapsed time: 0 seconds
#> Modularity Optimizer version 1.3.0 by Ludo Waltman and Nees Jan van Eck
#>
#> Number of nodes: 2638
#> Number of edges: 95927
#>
#> Running Louvain algorithm...
#> Maximum modularity in 10 random starts: 0.8411
#> Number of communities: 10
#> Elapsed time: 0 seconds
#> Modularity Optimizer version 1.3.0 by Ludo Waltman and Nees Jan van Eck
#>
#> Number of nodes: 2638
#> Number of edges: 95927
#>
#> Running Louvain algorithm...
#> Maximum modularity in 10 random starts: 0.8281
#> Number of communities: 11
#> Elapsed time: 0 seconds
#> Modularity Optimizer version 1.3.0 by Ludo Waltman and Nees Jan van Eck
#>
#> Number of nodes: 2638
#> Number of edges: 95927
#>
#> Running Louvain algorithm...
#> Maximum modularity in 10 random starts: 0.8159
#> Number of communities: 11
#> Elapsed time: 0 seconds
#> Modularity Optimizer version 1.3.0 by Ludo Waltman and Nees Jan van Eck
#>
#> Number of nodes: 2638
#> Number of edges: 95927
#>
#> Running Louvain algorithm...
#> Maximum modularity in 10 random starts: 0.8036
#> Number of communities: 11
#> Elapsed time: 0 seconds
#> Modularity Optimizer version 1.3.0 by Ludo Waltman and Nees Jan van Eck
#>
#> Number of nodes: 2638
#> Number of edges: 95927
#>
#> Running Louvain algorithm...
#> Maximum modularity in 10 random starts: 0.7918
#> Number of communities: 11
#> Elapsed time: 0 seconds
#> Modularity Optimizer version 1.3.0 by Ludo Waltman and Nees Jan van Eck
#>
#> Number of nodes: 2638
#> Number of edges: 95927
#>
#> Running Louvain algorithm...
#> Maximum modularity in 10 random starts: 0.7798
#> Number of communities: 12
#> Elapsed time: 0 seconds
#> Modularity Optimizer version 1.3.0 by Ludo Waltman and Nees Jan van Eck
#>
#> Number of nodes: 2638
#> Number of edges: 95927
#>
#> Running Louvain algorithm...
#> Maximum modularity in 10 random starts: 0.7678
#> Number of communities: 13
#> Elapsed time: 0 seconds
#> Modularity Optimizer version 1.3.0 by Ludo Waltman and Nees Jan van Eck
#>
#> Number of nodes: 2638
#> Number of edges: 95927
#>
#> Running Louvain algorithm...
#> Maximum modularity in 10 random starts: 0.7575
#> Number of communities: 13
#> Elapsed time: 0 seconds
#> Modularity Optimizer version 1.3.0 by Ludo Waltman and Nees Jan van Eck
#>
#> Number of nodes: 2638
#> Number of edges: 95927
#>
#> Running Louvain algorithm...
#> Maximum modularity in 10 random starts: 0.7473
#> Number of communities: 13
#> Elapsed time: 0 seconds
#> Modularity Optimizer version 1.3.0 by Ludo Waltman and Nees Jan van Eck
#>
#> Number of nodes: 2638
#> Number of edges: 95927
#>
#> Running Louvain algorithm...
#> Maximum modularity in 10 random starts: 0.7370
#> Number of communities: 15
#> Elapsed time: 0 seconds
#> Modularity Optimizer version 1.3.0 by Ludo Waltman and Nees Jan van Eck
#>
#> Number of nodes: 2638
#> Number of edges: 95927
#>
#> Running Louvain algorithm...
#> Maximum modularity in 10 random starts: 0.7280
#> Number of communities: 15
#> Elapsed time: 0 seconds
#> Modularity Optimizer version 1.3.0 by Ludo Waltman and Nees Jan van Eck
#>
#> Number of nodes: 2638
#> Number of edges: 95927
#>
#> Running Louvain algorithm...
#> Maximum modularity in 10 random starts: 0.7185
#> Number of communities: 15
#> Elapsed time: 0 seconds
#> Modularity Optimizer version 1.3.0 by Ludo Waltman and Nees Jan van Eck
#>
#> Number of nodes: 2638
#> Number of edges: 95927
#>
#> Running Louvain algorithm...
#> Maximum modularity in 10 random starts: 0.7093
#> Number of communities: 15
#> Elapsed time: 0 seconds
#> Modularity Optimizer version 1.3.0 by Ludo Waltman and Nees Jan van Eck
#>
#> Number of nodes: 2638
#> Number of edges: 95927
#>
#> Running Louvain algorithm...
#> Maximum modularity in 10 random starts: 0.7002
#> Number of communities: 16
#> Elapsed time: 0 seconds
# the different clustering created
names(pbmc@meta.data)
#>  [1] "orig.ident"      "nCount_RNA"      "nFeature_RNA"
#>  [4] "percent.mt"      "RNA_snn_res.0.5" "seurat_clusters"
#>  [7] "RNA_snn_res.0.1" "RNA_snn_res.0.2" "RNA_snn_res.0.3"
#> [10] "RNA_snn_res.0.4" "RNA_snn_res.0.6" "RNA_snn_res.0.7"
#> [13] "RNA_snn_res.0.8" "RNA_snn_res.0.9" "RNA_snn_res.1"
#> [16] "RNA_snn_res.1.1" "RNA_snn_res.1.2" "RNA_snn_res.1.3"
#> [19] "RNA_snn_res.1.4" "RNA_snn_res.1.5" "RNA_snn_res.1.6"
#> [22] "RNA_snn_res.1.7" "RNA_snn_res.1.8" "RNA_snn_res.1.9"
#> [25] "RNA_snn_res.2"

# How many clusters (and how many cells in those clusters) do we get at different resolutions?
table(pbmc$RNA_snn_res.0.1)
#>
#>    0    1    2    3
#> 1190  688  416  344
table(pbmc$RNA_snn_res.0.5)
#>
#>   0   1   2   3   4   5   6   7   8
#> 684 481 476 344 291 162 155  32  13
table(pbmc$RNA_snn_res.2)
#>
#>   0   1   2   3   4   5   6   7   8   9  10  11  12  13  14
#> 372 344 266 245 215 174 164 162 155 140 127  91  70  67  32
#>  15
#>  14
Plot a ‘clustree’ to decide how many clusters you have and what resolution capture them.
library(clustree)
#> Loading required package: ggraph
#>
#> Attaching package: 'ggraph'
#> The following object is masked from 'package:sp':
#>
#>     geometry
clustree(pbmc, prefix = "RNA_snn_res.") + theme(legend.key.size = unit(0.05, "cm"))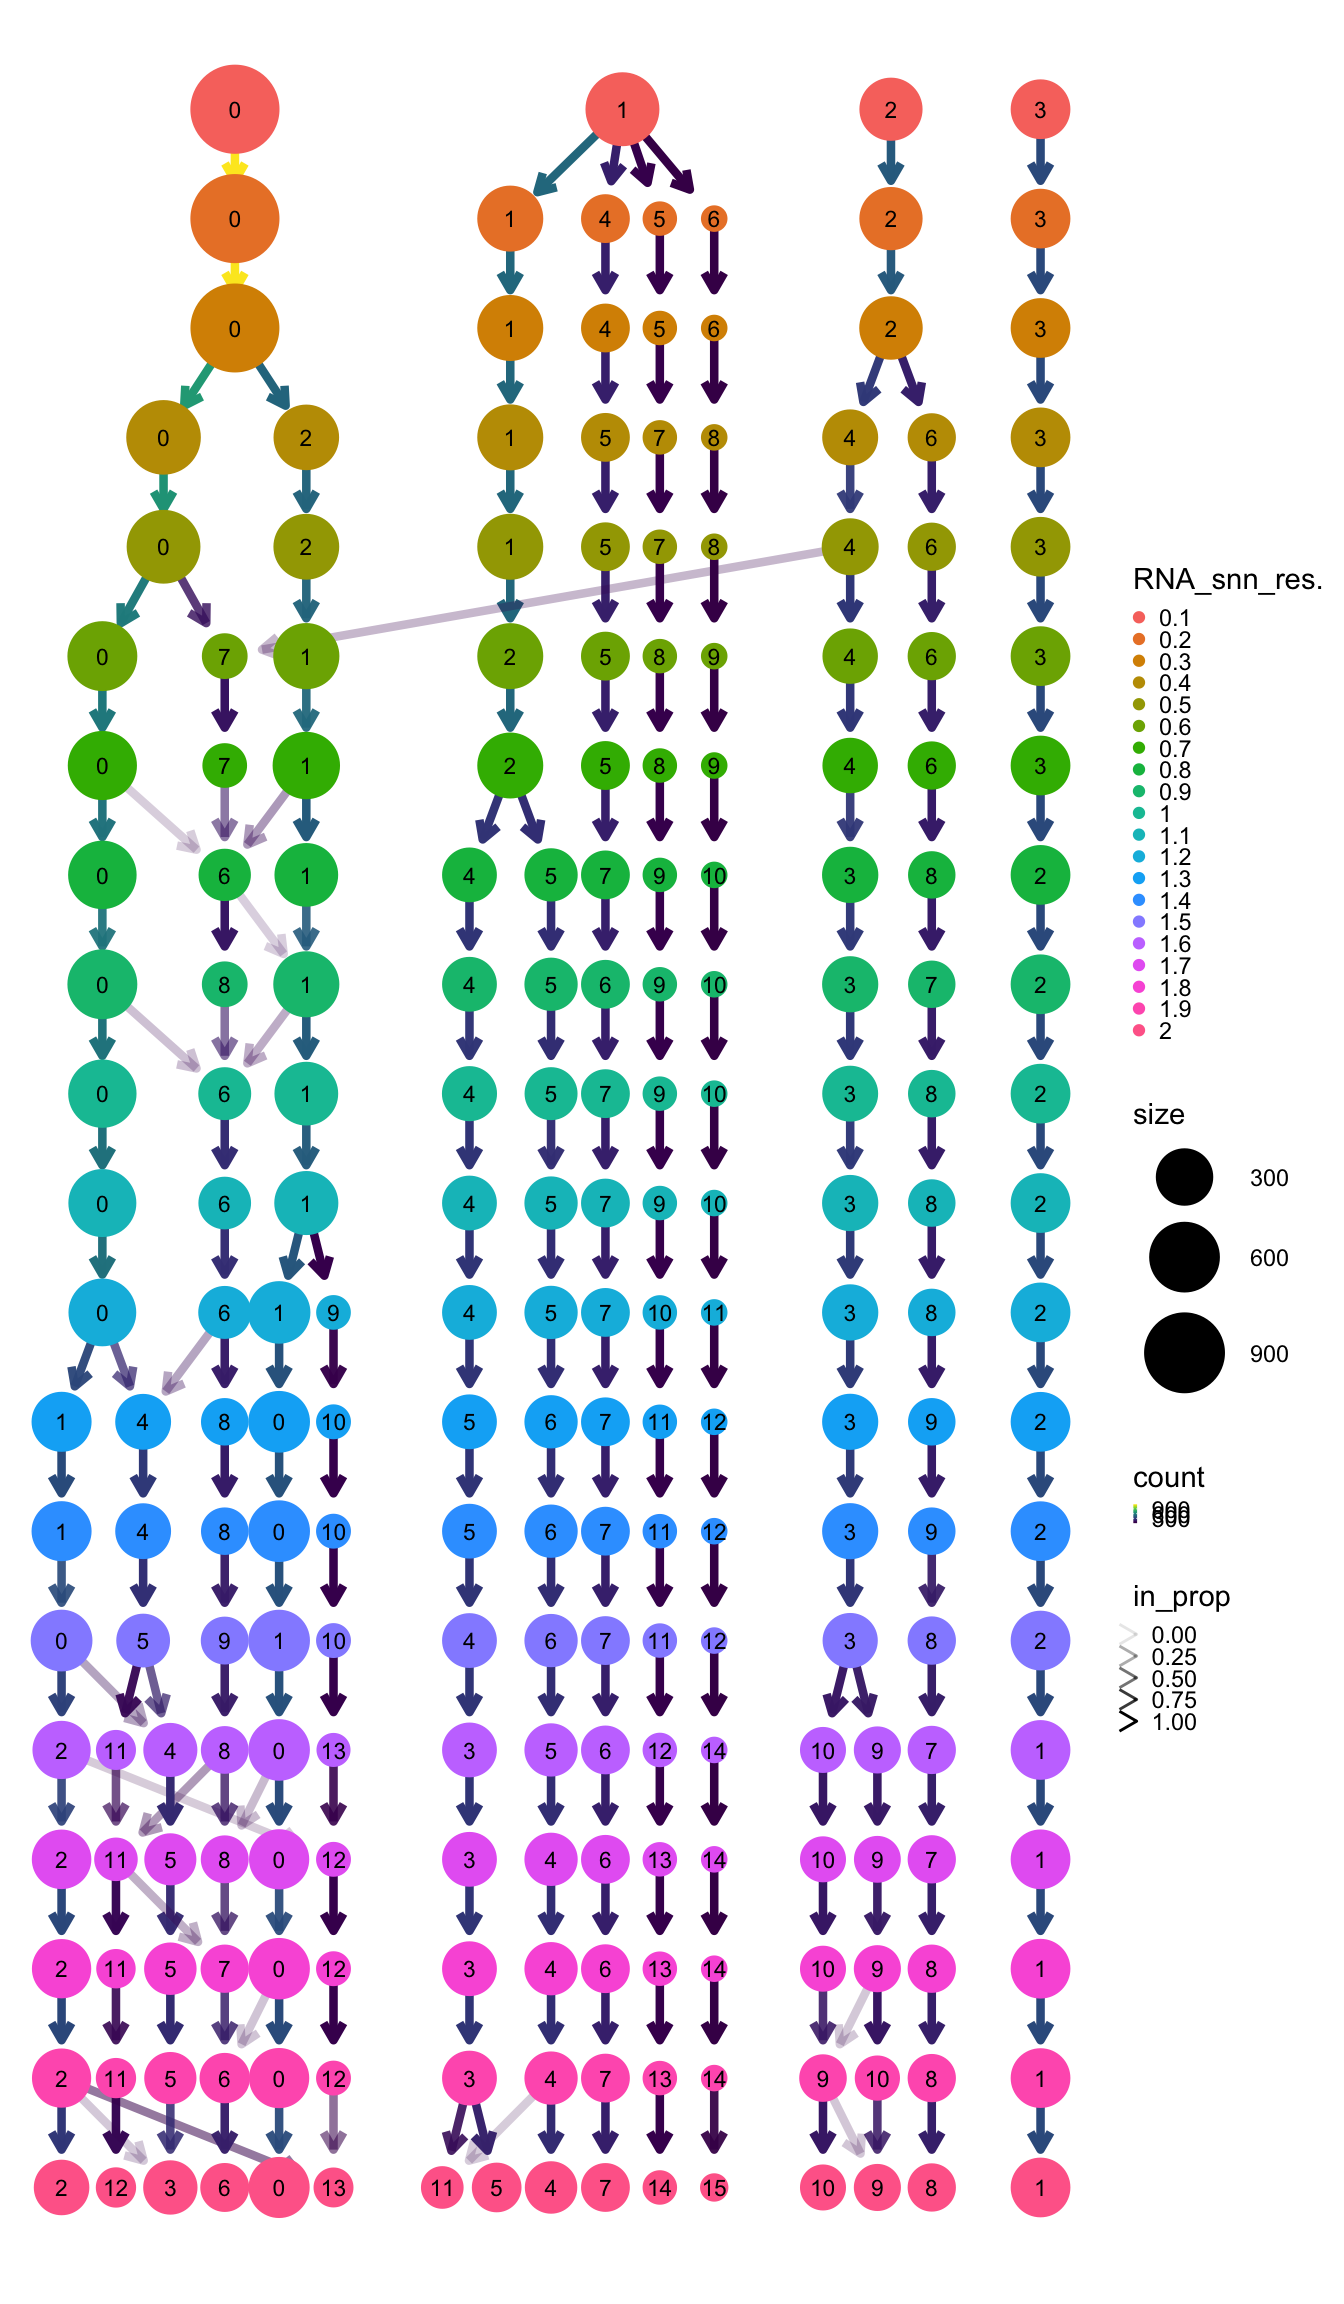
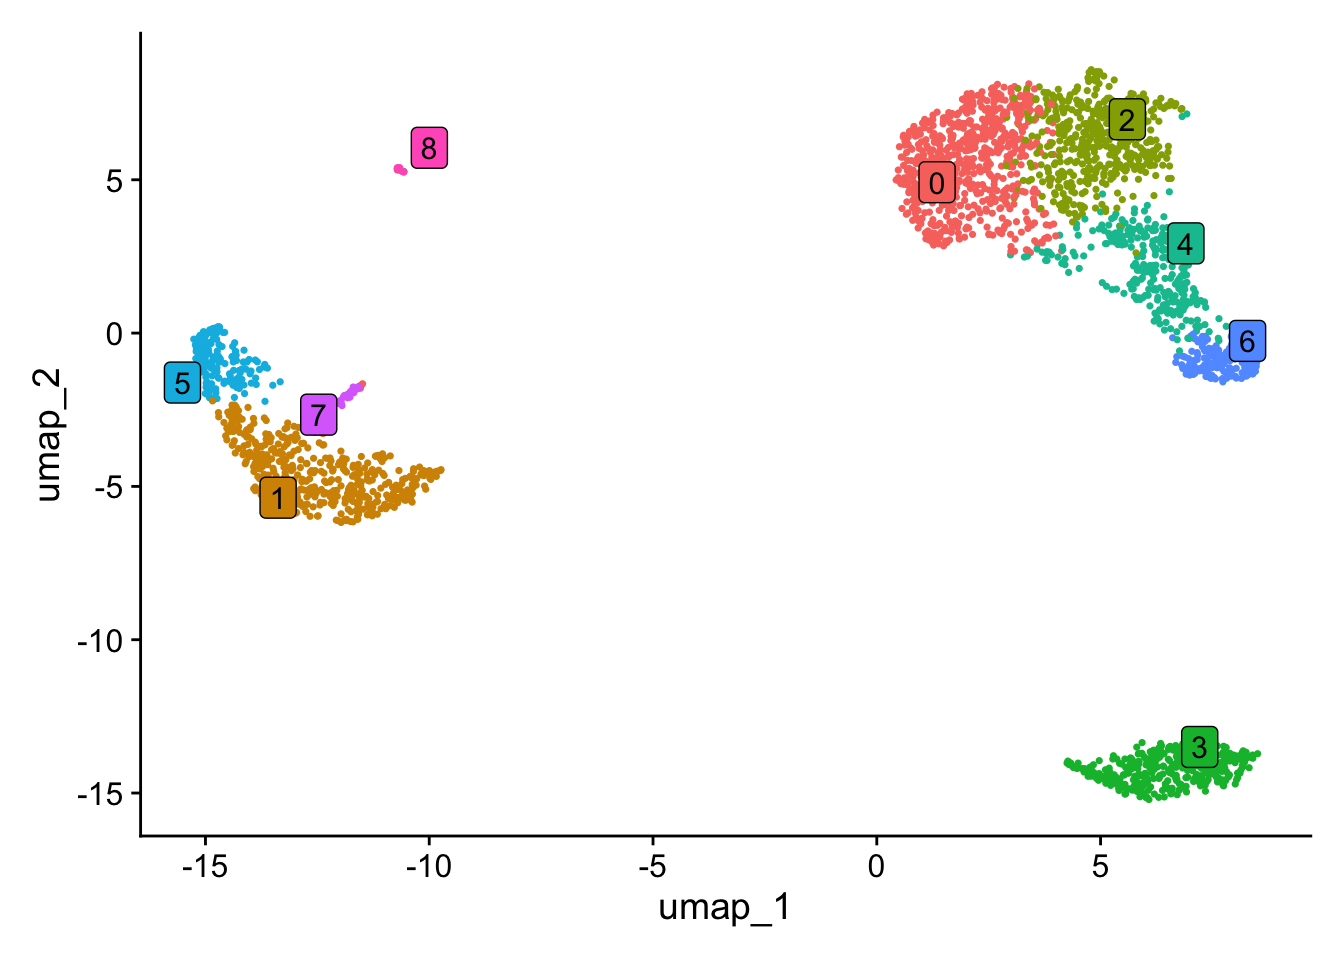
Name cells with the corresponding cluster name at the resolution you pick. This case we are happy with 0.5.
# The name of the cluster is prefixed with 'RNA_snn_res' and the number of the resolution
Idents(pbmc) <- pbmc$RNA_snn_res.0.5
Plot the UMAP with coloured clusters with Dimplot