12 Clustering Labeling
Classifing cells into meaningful celltypes (or cell states) is a time consuming, but extremely improtant, part of a spatial analysis.
It may involve pulling together multiple lines of evidence to assign celltype labels to cluster labels. Some approaches outlined below:
12.1 Cluster Markers
DimPlot(so, group.by='seurat_clusters')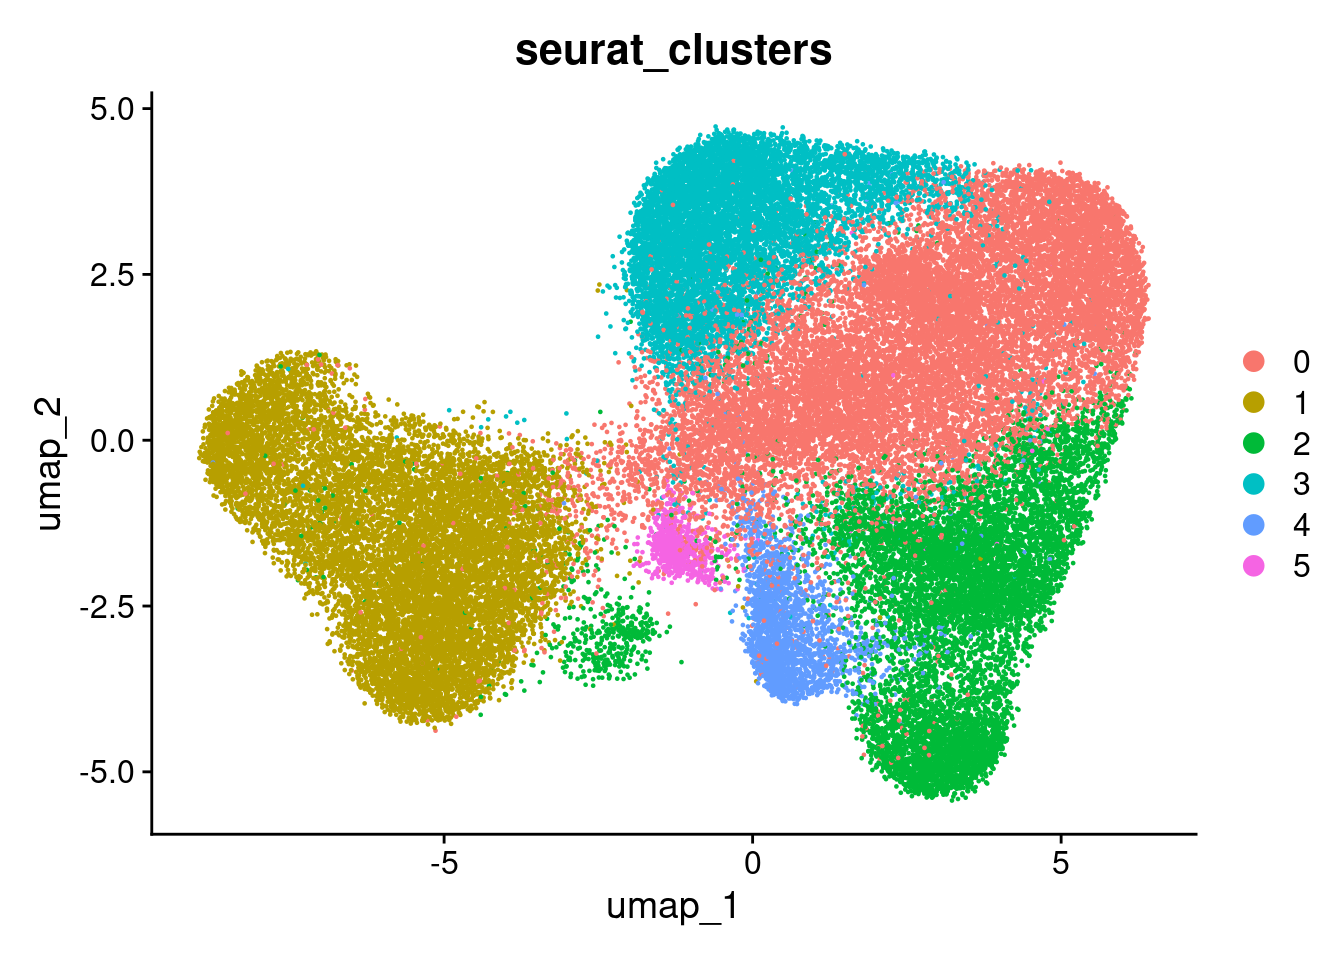
so <- JoinLayers(so)
marker_table <- FindAllMarkers(so, group.by='seurat_clusters', only.pos=TRUE)
## Warning: The `slot` argument of `GetAssayData()` is deprecated as of SeuratObject 5.0.0.
## ℹ Please use the `layer` argument instead.
## ℹ The deprecated feature was likely used in the Seurat package.
## Please report the issue at <https://github.com/satijalab/seurat/issues>.
## This warning is displayed once every 8 hours.
## Call `lifecycle::last_lifecycle_warnings()` to see where this warning was generated.## Warning: `PackageCheck()` was deprecated in SeuratObject 5.0.0.
## ℹ Please use `rlang::check_installed()` instead.
## ℹ The deprecated feature was likely used in the Seurat package.
## Please report the issue at <https://github.com/satijalab/seurat/issues>.
## This warning is displayed once every 8 hours.
## Call `lifecycle::last_lifecycle_warnings()` to see where this warning was generated.
marker_table_top <- marker_table %>%
    group_by(cluster) %>%
    dplyr::filter(avg_log2FC > 1, p_val_adj < 0.01) %>%
    slice_head(n = 5)
Plot cluster specific genes on a heatmap on a subset of 5000 cells.
## Warning: Not validating FOV objects## Warning: Not validating Centroids objects
## Not validating Centroids objects## Warning: Not validating FOV objects## Warning: Not validating Centroids objects## Warning: Not validating FOV objects
## Not validating FOV objects
## Not validating FOV objects## Warning: Not validating Seurat objects## Warning: Not validating FOV objects## Warning: Not validating Centroids objects
## Not validating Centroids objects## Warning: Not validating FOV objects## Warning: Not validating Centroids objects## Warning: Not validating FOV objects
## Not validating FOV objects
## Not validating FOV objects## Warning: Not validating Seurat objects
DoHeatmap(so.mini, assay='RNA', features = marker_table_top$gene) 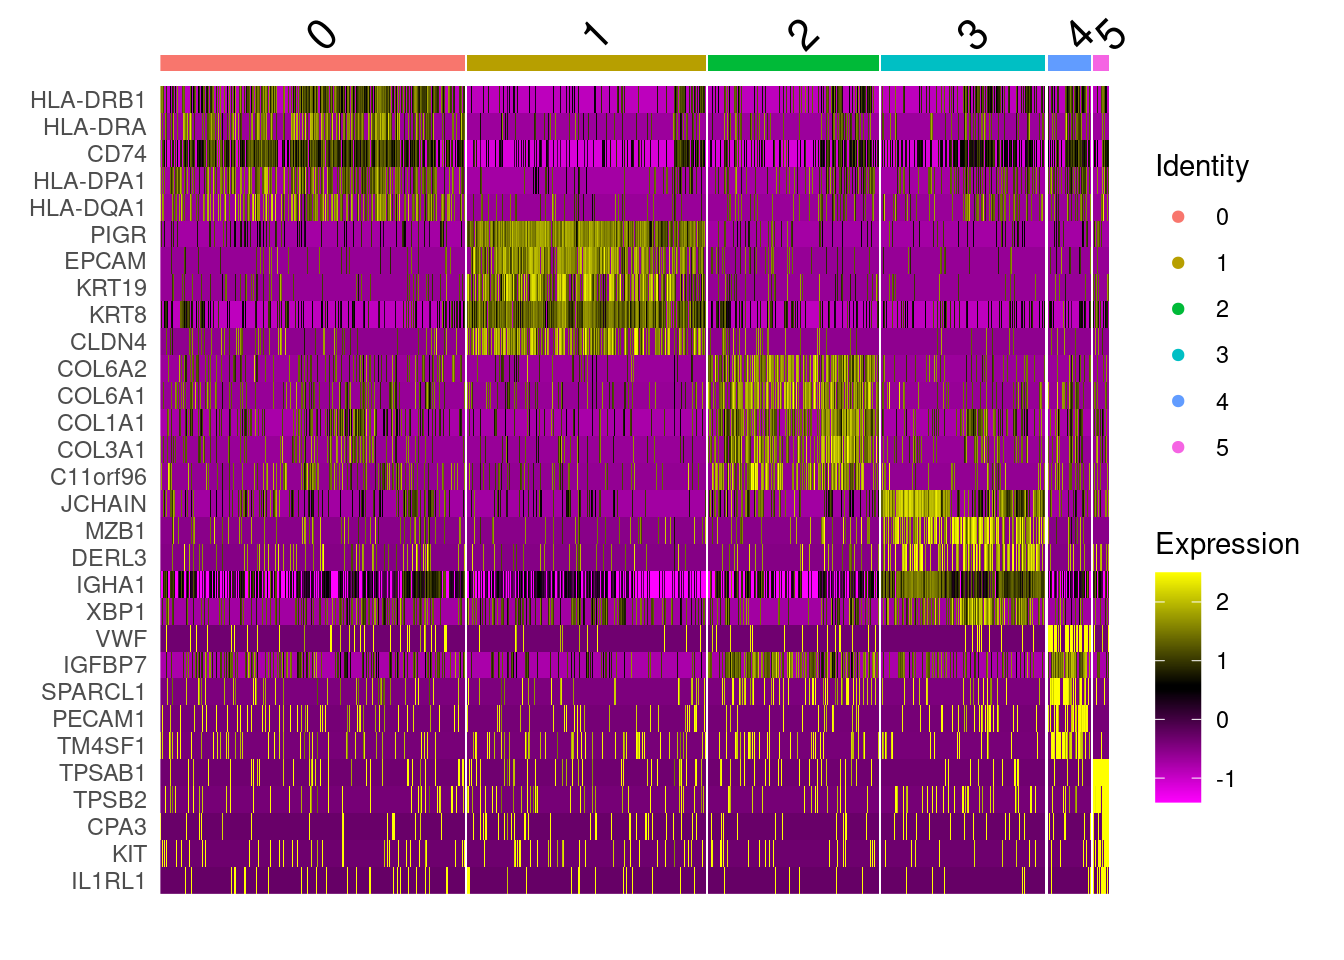
12.2 Cell typing by reference
There are a number of tools that classify cells into types on the basis of similarity with a reference dataset. SingleR is one such tool.
## Warning: replacing previous import 'S4Arrays::makeNindexFromArrayViewport' by
## 'DelayedArray::makeNindexFromArrayViewport' when loading 'SummarizedExperiment'
But first we need to aquire a reference dataset.
A typical reference would be from a public single cell datasets from a matched celltype with a trusted annotation. Look for a relevant paper which has provided their GEO accession number or similar. Note that not every study remembers to publish their annotations alongside their raw data, but the authors might be willing to supply you with a processed dataset if you ask.
Alternativly, there are some databases of single cell datasets - see Human Cell Atlas or CELLxGENE datasets. These databases also let you browse the data online - which is an excellent resource for the design or cell annotation stages; you can look up gene expression in a particular celltype to see if it matches what you are seeing.
There is also a package ‘celldex’ which hosts a small number of reference datasets ready to go. So for today, we will use the ‘human primary cell atalas’ reference, which includes celltypes from various different sites; Note that a sample specific reference would be better!
## Warning: replacing previous import 'S4Arrays::makeNindexFromArrayViewport' by
## 'DelayedArray::makeNindexFromArrayViewport' when loading 'HDF5Array'
# Gives us a 'SummarizedExperiment object'
se_ref <- celldex::HumanPrimaryCellAtlasData()
A reference dataset approach can only choose from the celltypes it has.
unique(se_ref$label.main)## [1] "DC" "Smooth_muscle_cells" "Epithelial_cells"
## [4] "B_cell" "Neutrophils" "T_cells"
## [7] "Monocyte" "Erythroblast" "BM & Prog."
## [10] "Endothelial_cells" "Gametocytes" "Neurons"
## [13] "Keratinocytes" "HSC_-G-CSF" "Macrophage"
## [16] "NK_cell" "Embryonic_stem_cells" "Tissue_stem_cells"
## [19] "Chondrocytes" "Osteoblasts" "BM"
## [22] "Platelets" "Fibroblasts" "iPS_cells"
## [25] "Hepatocytes" "MSC" "Neuroepithelial_cell"
## [28] "Astrocyte" "HSC_CD34+" "CMP"
## [31] "GMP" "MEP" "Myelocyte"
## [34] "Pre-B_cell_CD34-" "Pro-B_cell_CD34+" "Pro-Myelocyte"Note that singleR and celldex are bioconductor packages - they don’t natively work with Seurat objects. Rather SpatialExperiments/SpatialFeatureExperiment/SingleCellExperiments/SummarizedExperiment (For software folk; these inherit from SummarizedExperiment)
We could build a ‘SingleCellExperiment’ object - but singleR works just fine with a matrix of expression.
norm_matrix <- GetAssayData(so, assay = 'RNA', layer = 'data')
predictions <- SingleR::SingleR(test = norm_matrix, ref = se_ref, labels = se_ref$label.main)
Store back in the object, and plot. There are too many celltypes to show nicely, and some aren’t that relevant.
so$singleR_labels <- predictions$labels
DimPlot(so, group.by='singleR_labels')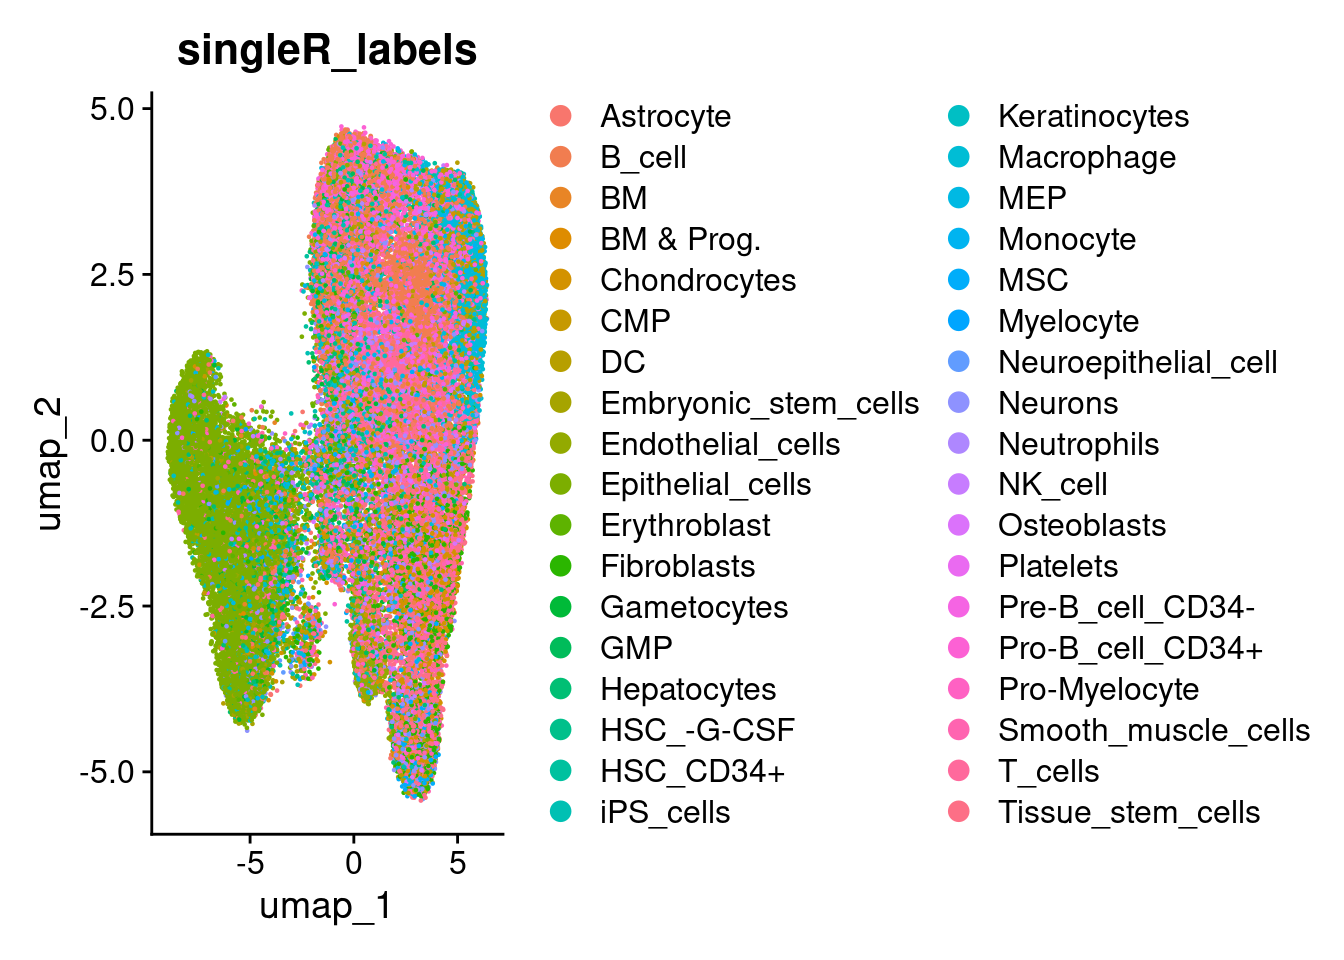
TODO: Ideally use a better reference that doesn’t need this much post processing to be useful! Or make clearer what is being done here.
so$singleR_delta.next <- predictions$delta.next
VlnPlot(so, features='singleR_delta.next', group.by='singleR_labels', pt.size = 0) + NoLegend()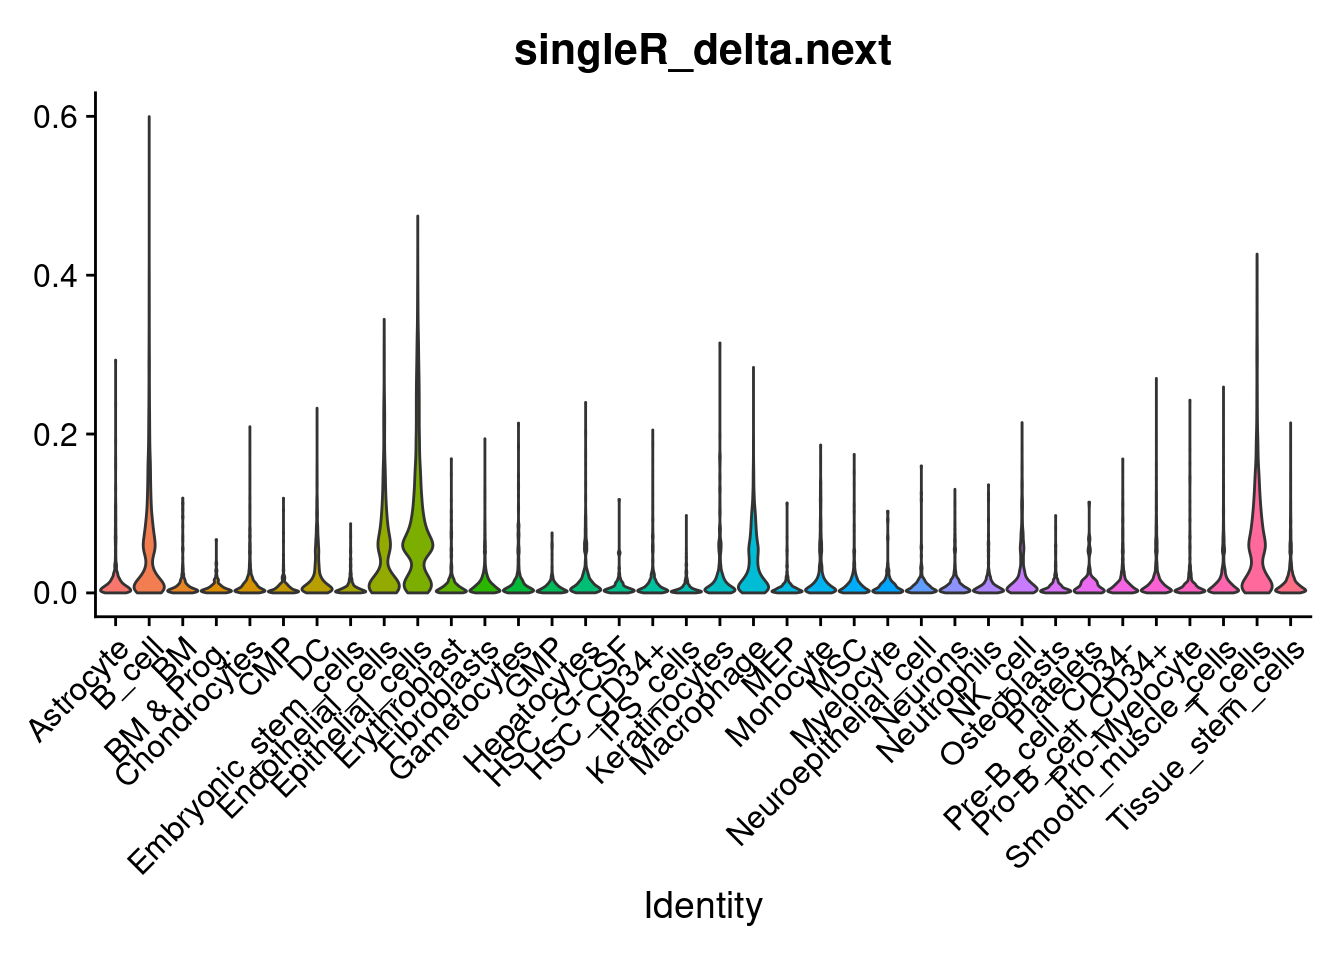
min_delta_next_threshold <- 0.05
min_cells_in_group       <- 50
so$singleR_labels_thresh <- ifelse ( so$singleR_delta.next > min_delta_next_threshold ,  so$singleR_labels, NA)
DimPlot(so, group.by='singleR_labels_thresh')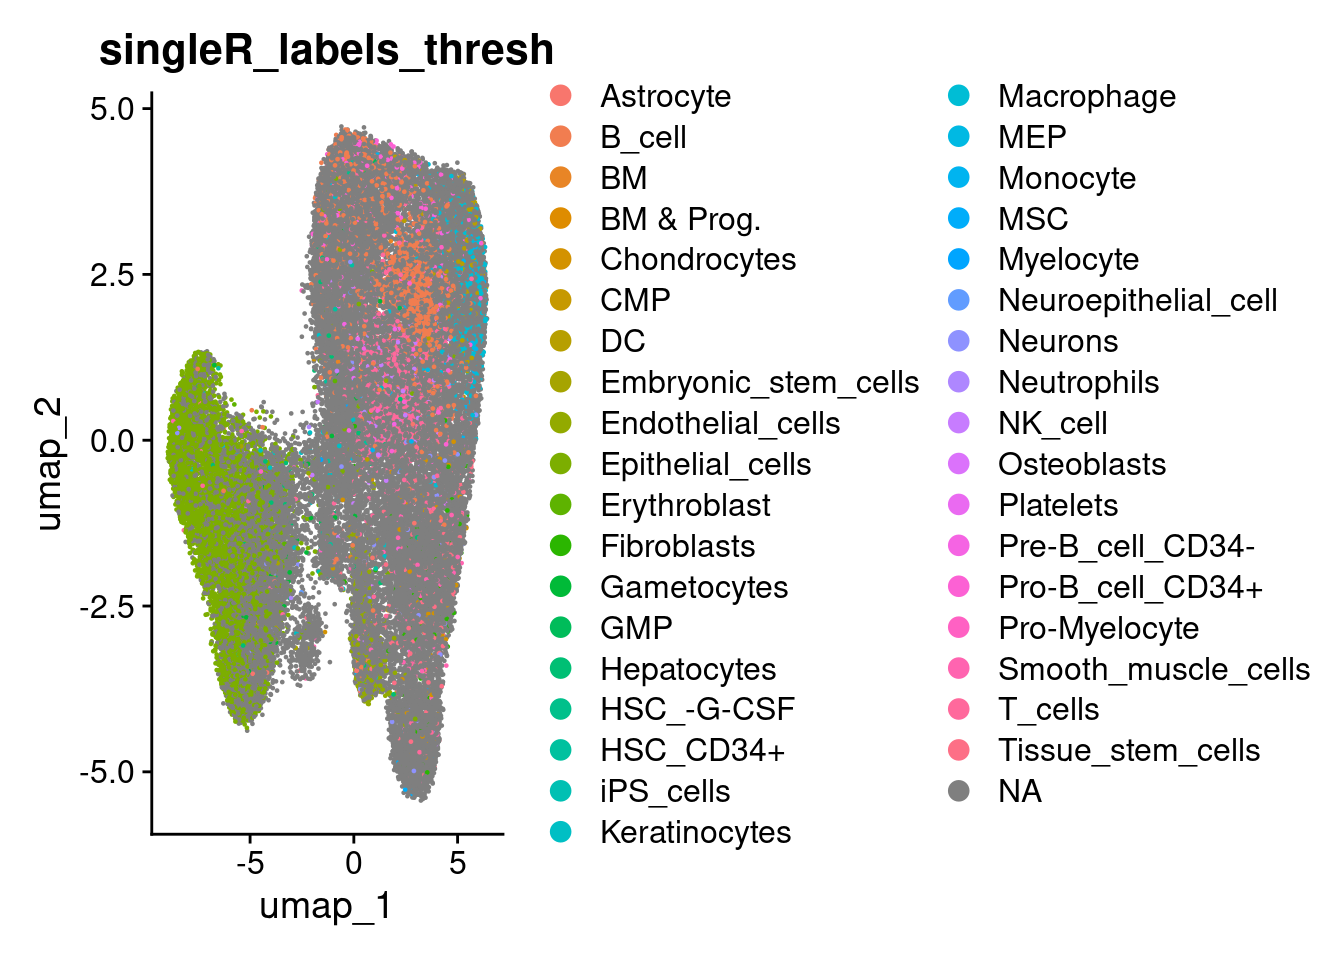
counts_per_group <- table(so$singleR_labels_thresh)
keep_groups      <- names(counts_per_group)[counts_per_group > 50]
so$singleR_labels_filt <- ifelse( so$singleR_labels_thresh %in% keep_groups ,    so$singleR_labels_thresh, NA)
DimPlot(so, group.by='singleR_labels_filt')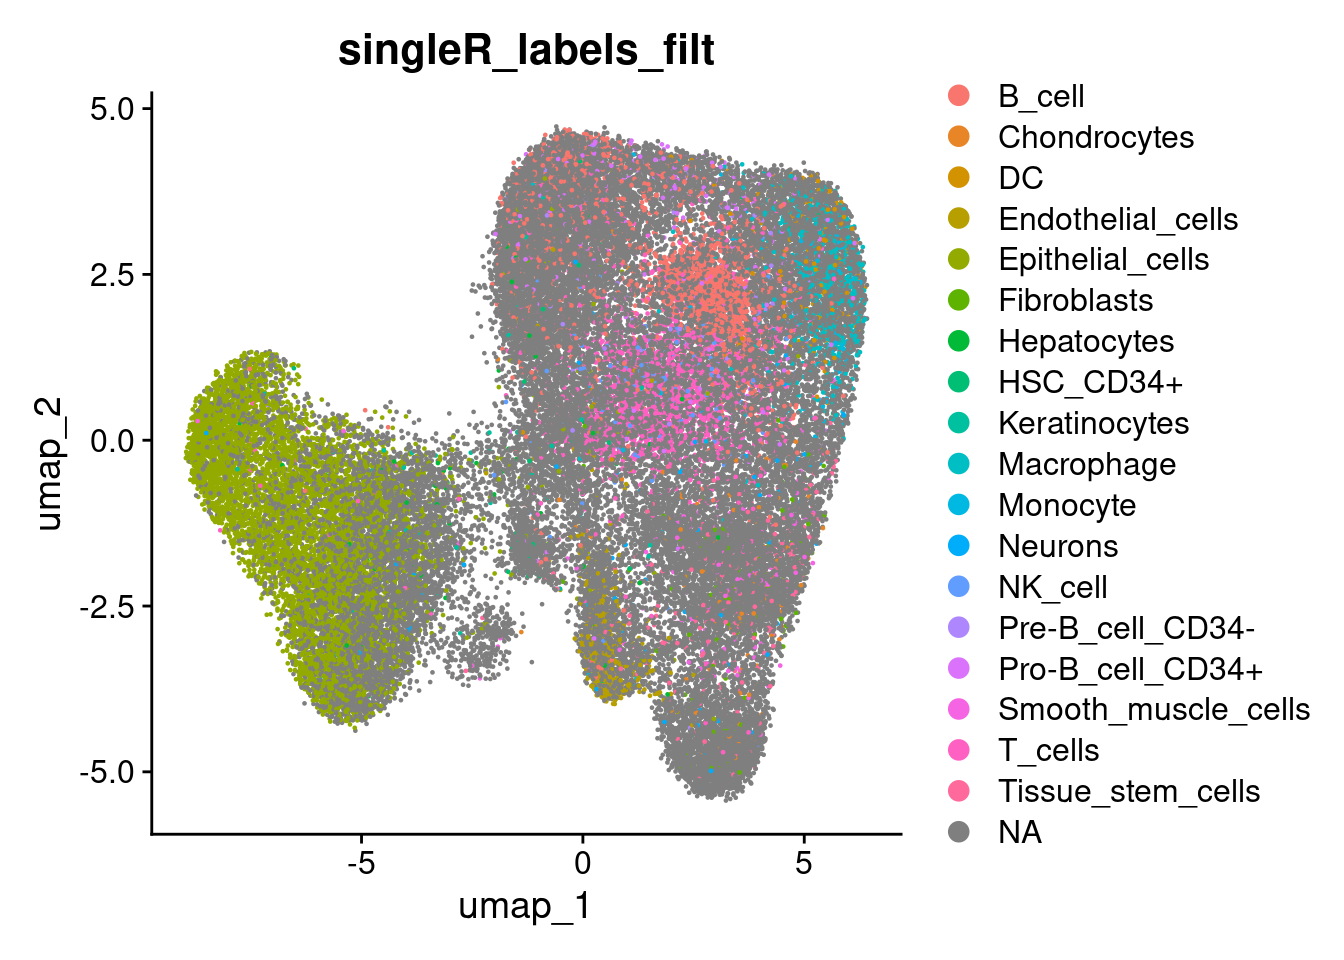
Its nice to line those classifications up with clusters.
## Celltype proportions
celltype_summary_table<- so@meta.data %>% as_tibble() %>%
  group_by(seurat_clusters, singleR_labels_filt ) %>%
  summarise(n_cells = n())
## `summarise()` has grouped output by 'seurat_clusters'. You can override using
## the `.groups` argument.
ggplot(celltype_summary_table, aes(x=seurat_clusters, y=n_cells, fill=singleR_labels_filt)) +
  geom_bar(position="fill", stat="identity") +
  theme_bw() +
  coord_flip() +
  theme(legend.position = "bottom") +
  scale_y_continuous(expand = c(0,0)) +
ggtitle( "Celltyping vs clustering") 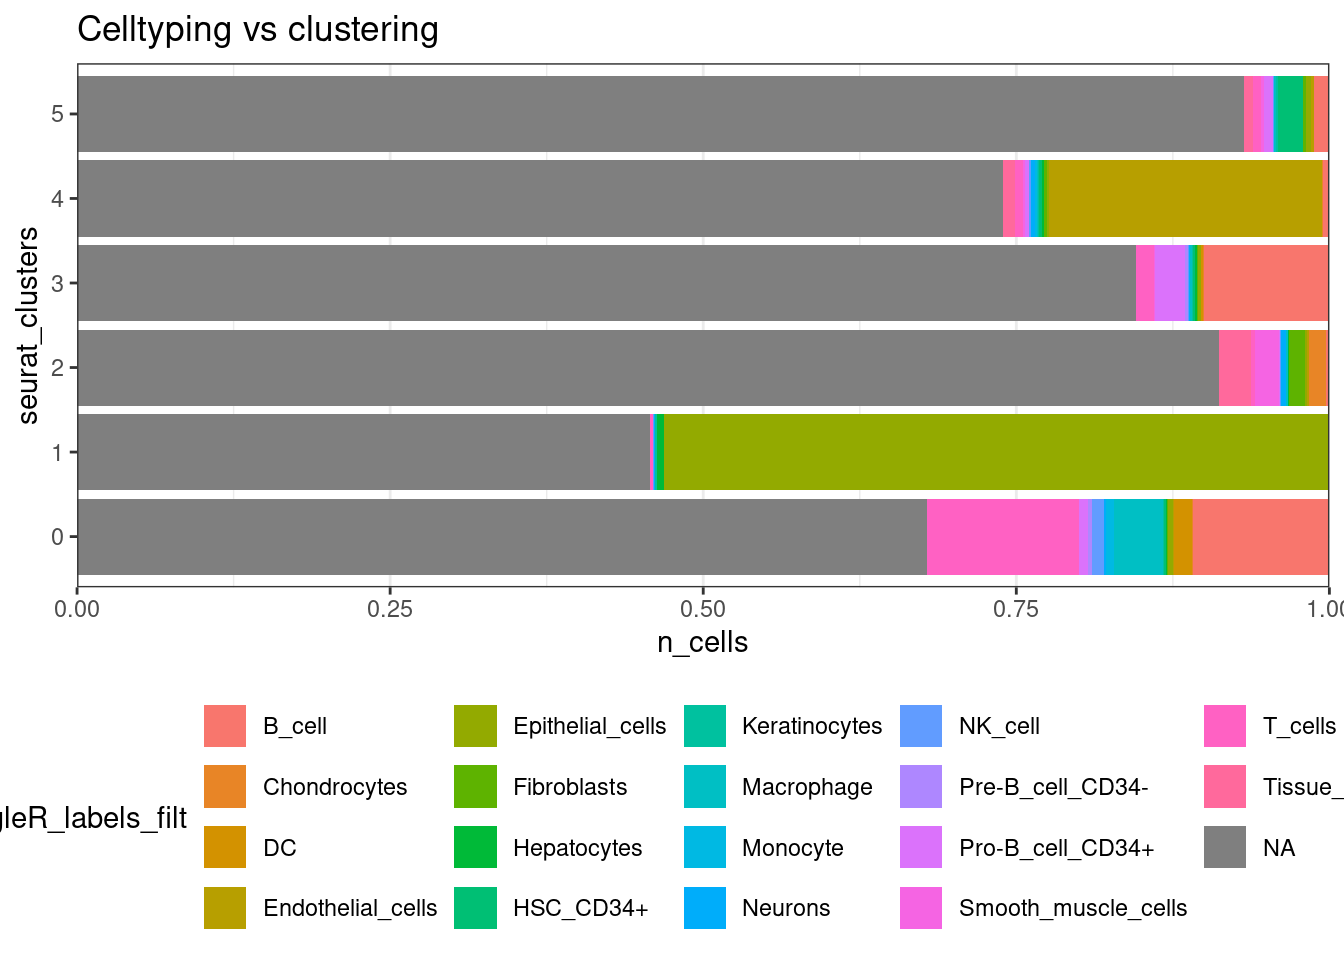
12.3 Spatial examination of plots
The clusters were defined purely on transcriptional similarity, but when plotted on tissue, their location pattern emerges. Here we can see that cluster 1 is epithelial cells.
Plotting both whole sample, and a zoomed in region of just one of the FOVs (in the cosmx definition) within it.
so_sample <- so[, so$tissue_sample=="HC_a"]## Warning: Not validating FOV objects## Warning: Not validating Centroids objects
## Not validating Centroids objects## Warning: Not validating FOV objects## Warning: Not validating Centroids objects## Warning: Not validating FOV objects
## Not validating FOV objects
## Not validating FOV objects## Warning: Not validating Seurat objects
## Not validating Seurat objects
## Not validating Seurat objects
## Not validating Seurat objects
## Not validating Seurat objects
## Not validating Seurat objects
ImageDimPlot(so_sample,
             fov          = "GSM7473682_HC_a",
             axes = TRUE,
             border.color = NA, border.size = 0.1,
             group.by = "seurat_clusters",
             boundaries   = "segmentation",
             crop=TRUE,
             nmols = 10000)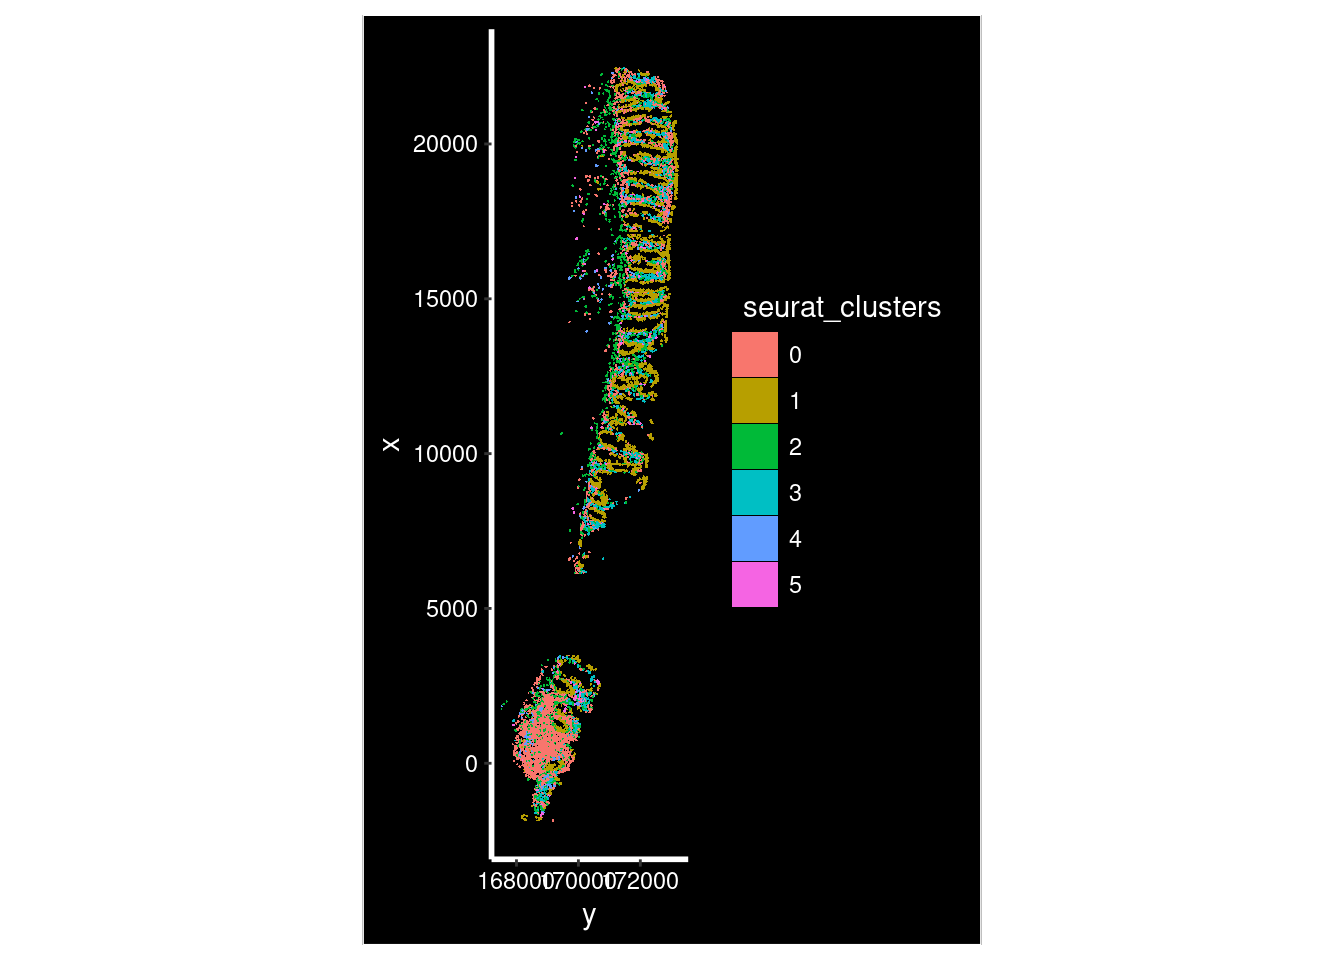
so_fov <- so_sample[, so_sample$fov==1]## Warning: Not validating FOV objects## Warning: Not validating Centroids objects
## Not validating Centroids objects## Warning: Not validating FOV objects## Warning: Not validating Centroids objects## Warning: Not validating FOV objects
## Not validating FOV objects
## Not validating FOV objects## Warning: Not validating Seurat objects
ImageDimPlot(so_fov,
             fov          = "GSM7473682_HC_a",
             axes = TRUE,
             border.color = NA, border.size = 0.1,
             group.by = "seurat_clusters",
             boundaries   = "segmentation",
             crop=TRUE,
             nmols = 10000)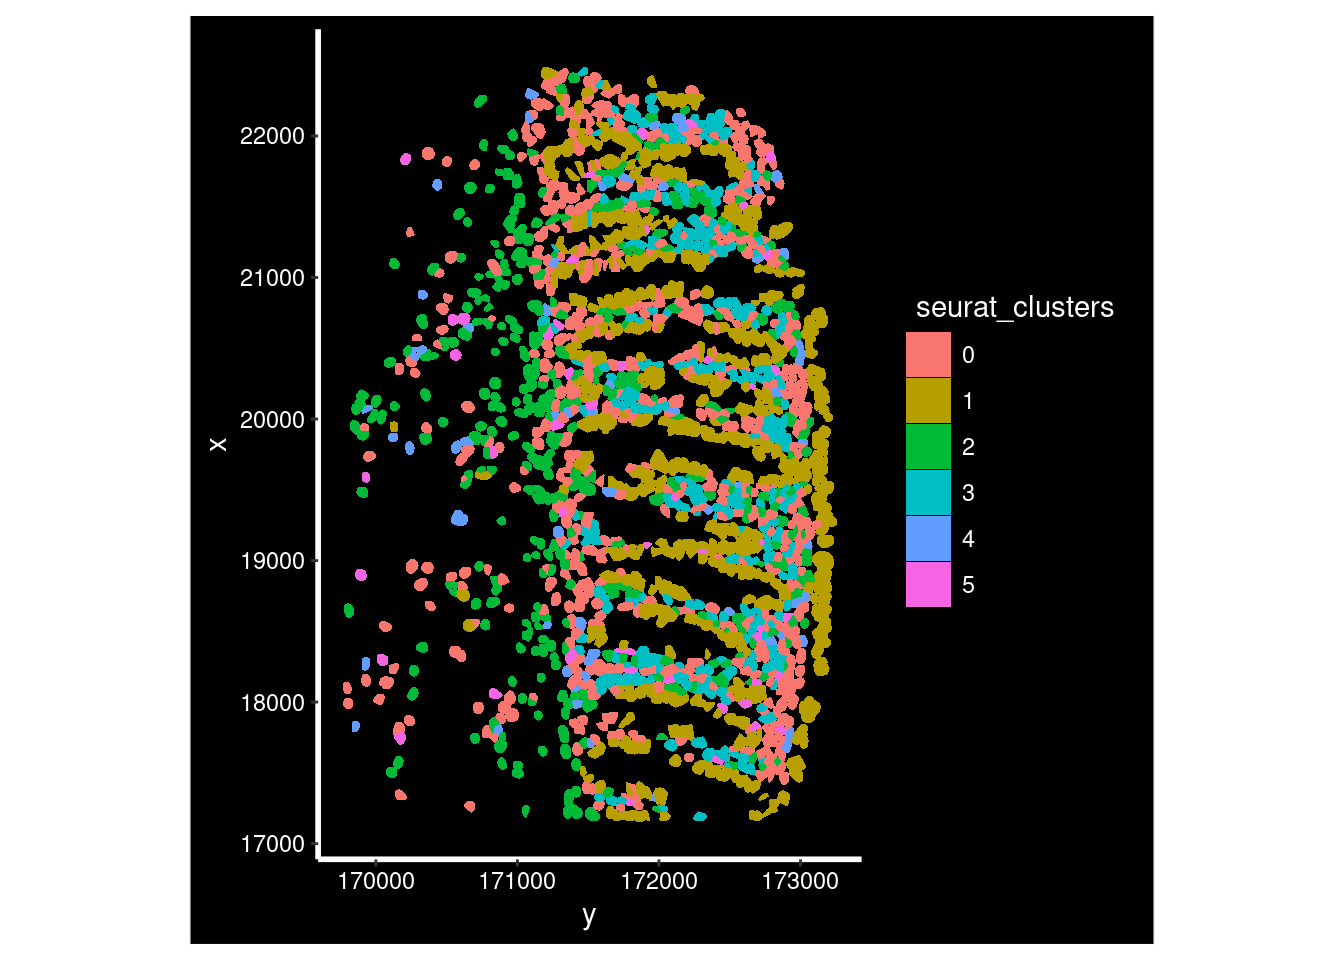
ImageDimPlot(so_fov,
             fov          = "GSM7473682_HC_a",
             axes = TRUE,
             border.color = NA, border.size = 0.1,
             group.by = "singleR_labels_filt",
             boundaries   = "segmentation",
             crop=TRUE,
             nmols = 10000)
## Warning: Removing 1669 cells missing data for vars requested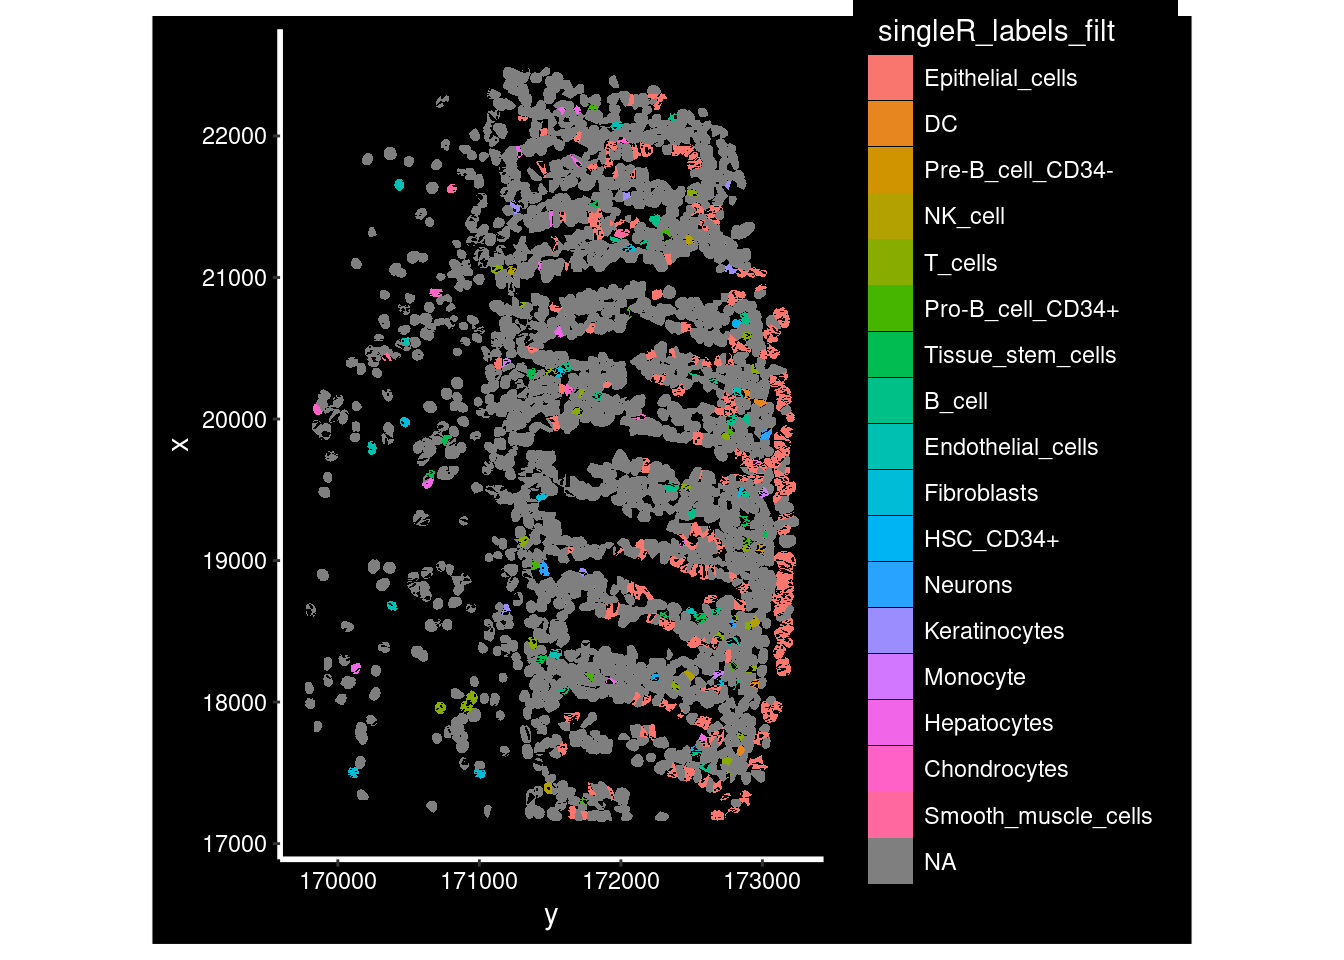
12.4 Recording celltype annotations.
## Apply some cluster names
so$cluster_code <- factor( paste0("c", so$seurat_clusters),   levels=paste0('c', levels(so$seurat_clusters)))
Idents(so) <- so$cluster_code

cluster_content <- list(
  c0 = "Unknown",
  c1 = "IntestinalEpithelia", # PIGR expression, epithelial location
  c2 = "Fibroblasts",         # Collagen rich
  c3 = "Plasma",              # MZB1, DERL3, JCHAIN
  c4 = "Endothelia",          # Mostly endothelial in cell typing.
  c5 = "Unknown"
)

# c5 => c5: Mono
so$cluster_labels <- factor (
  paste0(names(cluster_content[as.character(so$cluster_code)]), ": ", cluster_content[as.character(so$cluster_code)]) ,
  levels = paste0( names(cluster_content), ": ", cluster_content)
)
DimPlot(so, group.by='cluster_labels')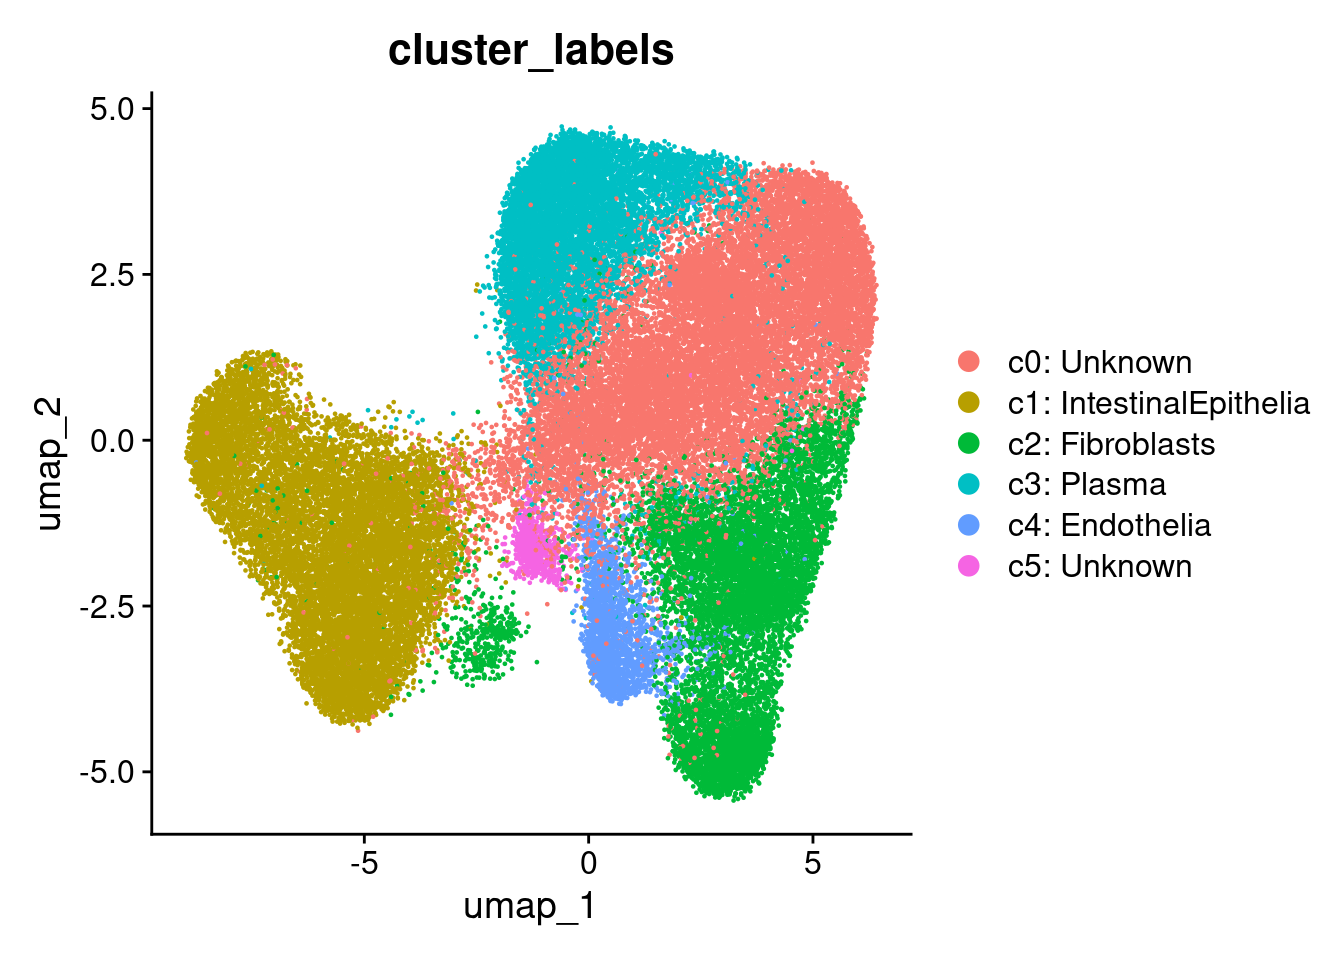
12.4.1 Pull in real annotation
The authors of this study have shared their actual celltypes. So in lieu of trying to figur this out - directly import their annotation
annotation_file <- 'data/GSE234713_CosMx_annotation.csv.gz'
anno_table <- read_csv(annotation_file, show_col_types = F)
anno_table <- as.data.frame(anno_table)
rownames(anno_table) <- anno_table$id

so$celltype <- factor(anno_table[colnames(so),]$subset)
From there can use celltype labels on visualiation:
so_fov <- so[, so$tissue_sample=="HC_a" & so_sample$fov==1]## Warning in so$tissue_sample == "HC_a" & so_sample$fov == 1: longer object
## length is not a multiple of shorter object length## Warning: Not validating FOV objects## Warning: Not validating Centroids objects
## Not validating Centroids objects## Warning: Not validating FOV objects## Warning: Not validating Centroids objects## Warning: Not validating FOV objects
## Not validating FOV objects
## Not validating FOV objects## Warning: Not validating Seurat objects
## Not validating Seurat objects
## Not validating Seurat objects
## Not validating Seurat objects
## Not validating Seurat objects
## Not validating Seurat objects
ImageDimPlot(so_fov,
             fov          = "GSM7473682_HC_a",
             axes = TRUE,
             border.color = NA, border.size = 0.1,
             group.by = "celltype",
             boundaries   = "segmentation",
             crop=TRUE,
             nmols = 10000)
## Warning: Removing 1 cells missing data for vars requested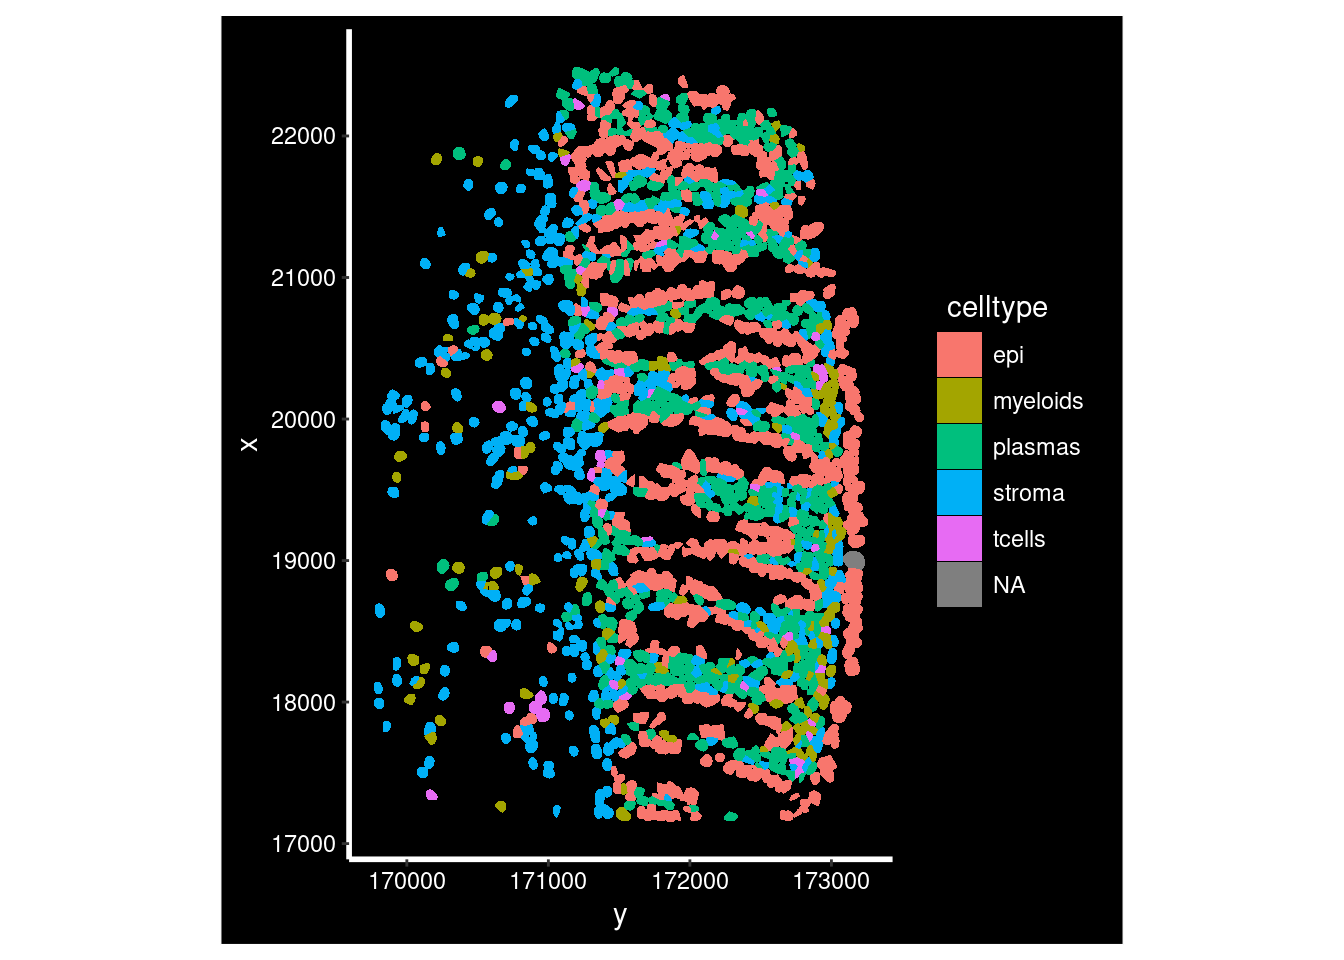
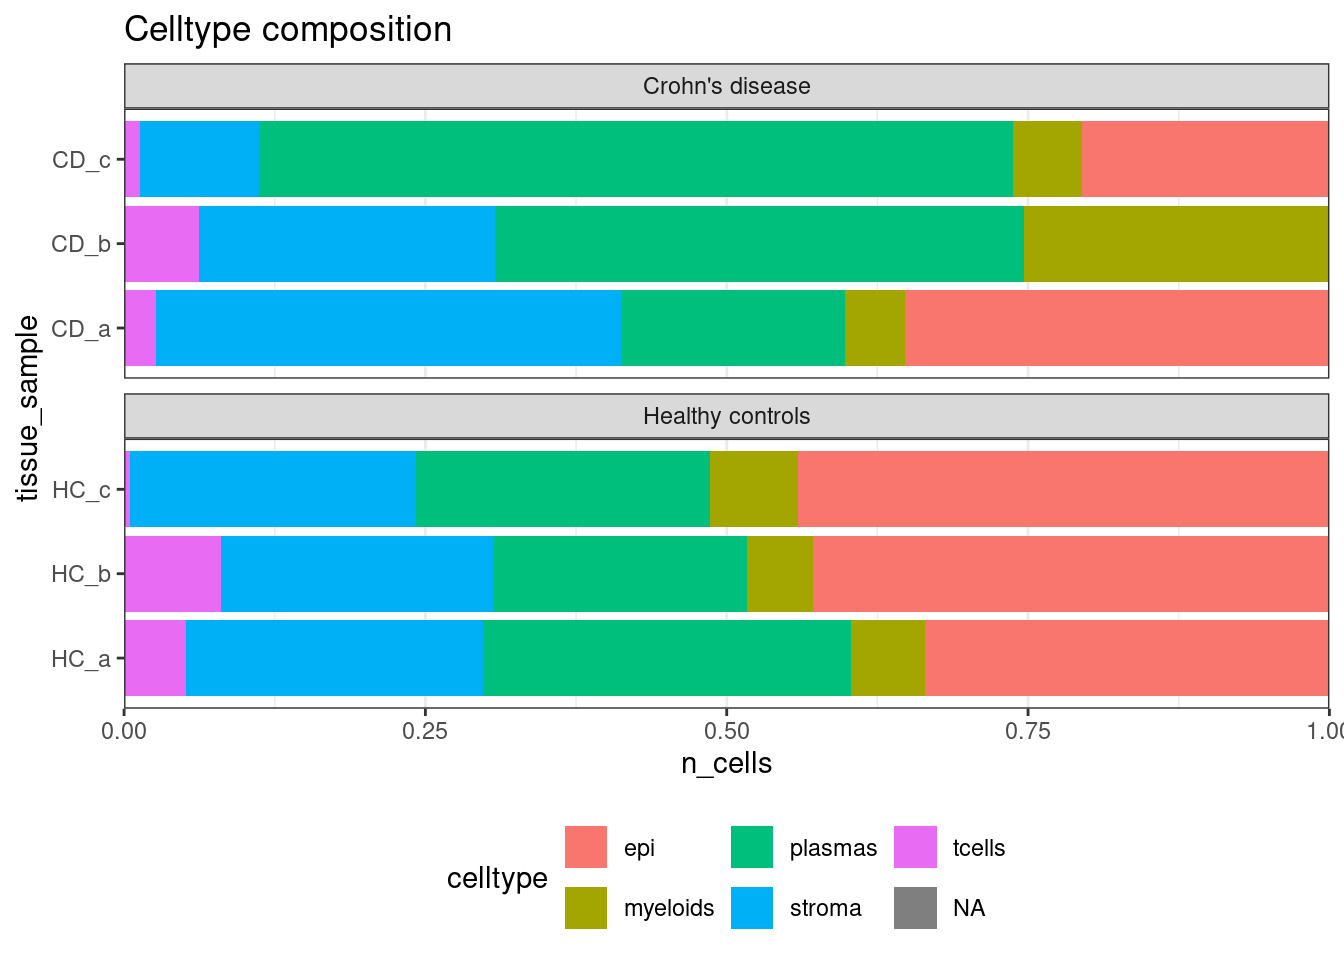
Or use them in other comparisons.
## Celltype proportions
celltype_summary_table<- so@meta.data %>% as_tibble() %>%
  group_by(condition, tissue_sample, celltype ) %>%
  summarise(n_cells = n())
## `summarise()` has grouped output by 'condition', 'tissue_sample'. You can override using the `.groups`
## argument.
ggplot(celltype_summary_table, aes(x=tissue_sample, y=n_cells, fill=celltype)) +
  geom_bar(position="fill", stat="identity") +
  theme_bw() +
  coord_flip() +
  theme(legend.position = "bottom") +
  scale_y_continuous(expand = c(0,0)) +
  ggtitle( "Celltype composition") +
  facet_wrap(~condition, ncol = 1, scales = 'free_y')